Cash Conversion Cycle: Bridging the Gap Between Profitability & Cash Flow

🔒 This is a free preview of a members-only post! 🔒 


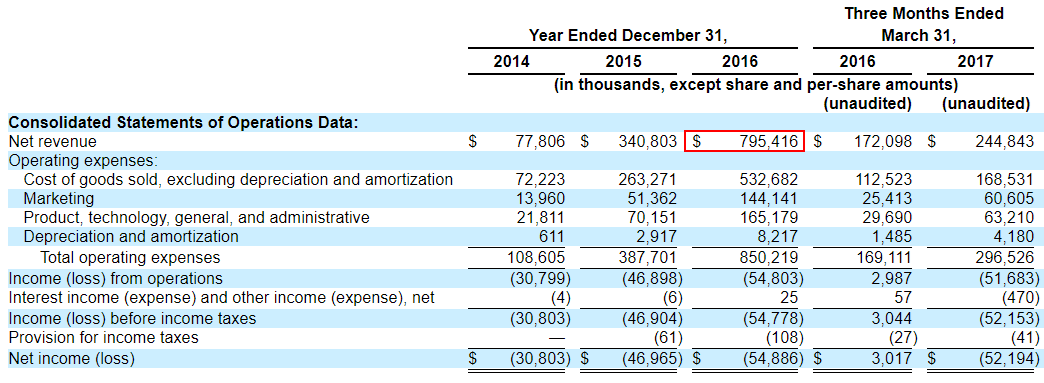
When an eCommerce business starts making more money, it costs more money to run. Consider an apparel business that sells athleisure. A pair of joggers might retail on the company’s website for $100 and cost them $40 to manufacture and ship. The gross margin on the joggers is $60 (60%), leaving that amount for all of the non-unit expenses like corporate salaries, rent & utilities and marketing. 

That all makes good sense. But what if you want to start this apparel company from scratch? You would need to pay the manufacturer for those joggers before you sold them to your customers. The income statement describes the profitability of a company, but it doesn’t describe the cash dynamics. 

A cash conversion cycle (CCC) is the amount of time it takes for a company to return the cash investment in inventory back to the company. CCC is important because it bridges the gap between profitability and cash flow. A high, positive CCC means that your cash is held up longer in inventory. A negative CCC means the opposite: your suppliers are financing your business for you. At zero interest. It’s highly preferable to have a negative CCC, but it’s hard to do! 

In this piece, we’re going to look at the formula for calculating CCC, and go through examples from eCommerce IPOs and startups that demonstrate how to improve CCC—and what to avoid. 

Income Statement <> Cash Flow Statement

Before we get into the details of the CCC, why do we use the income statement at all? The cash conversion cycle (and related metrics) doesn’t appear on the income statement. This is because it’s not related to the profitability of the company. This is intuitive at a small scale—you must buy the inventory before you get the cash from the sale to your customer. 

Financial statements are prepared for management, investors, lenders and other parties to make decisions about the business. There are two unique ideas here: the profitability of a company (revenue less expenses) and the financing relationship with their suppliers and customers. 

While cash flow is most important, the income statement is also very useful. You could imagine a situation where the limitations of an income statement are actually worth it. It doesn’t make sense for a company to buy $40 of inventory in March, show a $40 loss, then sell that inventory in April for $100 and show a $100 profit. Even though that’s what happens to the cash, investors want those numbers tied together in one time period to evaluate the prospects of the business. That’s the benefit of the income statement. 

Cash Conversion Cycle Formula

To measure the quantitative impact of this dynamic, companies track their cash conversion cycle. The CCC tracks the number of days it takes for a company to return it’s investment in inventory back to themselves. Here is the formula:

Days of Inventory Outstanding
+ 
Days Sales Outstanding
- 
Days Payable Outstanding 
=
Cash Conversion Cycle

Days of Inventory Outstanding (DIO) is the time it takes between when a company buys inventory and when they sell it. If a company’s DIO declines from 20 days to 15 days, that means that the company is selling inventory five days faster. They used to buy on the first of the month and sell it by the 20th, now they buy on the first and sell on the 15th.

Formula: (Average Inventory / Cost of Goods Sold) * 365
Cash Impact: An increase in DIO is a decrease in cash; a decrease in DIO is an increase in cash. 

Days Sales Outstanding (DSO) is the time it takes before receivables are collected. As an example, an original equipment manufacturer (OEM) like YKK (which manufactures zippers) might sell 10,000 units to an apparel company that makes joggers. These transactions are often bought on credit and invoiced, with terms to pay the supplier afterwards. A common payment term is Net 30—meaning the buyer has 30 days to pay the supplier. However long it takes, the number of days where the buyer has the goods but hasn’t paid the supplier yet is called Days Sales Outstanding.

Formula: (Average Accounts Receivables / Credit Sales) * 365
Cash Impact: An increase in DSO is a decrease in cash; a decrease in DSO is an increase in cash. 

Days Payable Outstanding (DPO) is the opposite of DSO—it’s the number of days it takes for a company to pay its own bills and invoices to its creditors. In that same example, YKK might buy chemicals and plastics to make their zippers. The amount of days between when YKK gets the supplies and when YKK actually pays their supplier is their DPO.

Formula: (Average Accounts Payables / COGS) * 365
Cash Impact: An increase in DPO is an increase in cash; a decrease in DPO is a decrease in cash. 

Example Calculation - Blue Apron 

So, if we wanted to calculate a company’s CCC from scratch, we would need the following metrics:

  • Revenue
  • Cost of Goods Sold
  • Previous Year Inventory
  • Current Year Inventory
  • Previous Year Accounts Receivables
  • Current Year Accounts Receivables
  • Previous Year Accounts Payables
  • Current Year Accounts Payables

To show how we would find this data, I’m going to use Blue Apron’s Form S-1 as an example (we are going to use fiscal year 2016 for simplicity). 

Revenue: $795,416,000 (Page 13)

Cost of Goods Sold: $532,682,000 (Page 13)

Previous Year Inventory: $17,476,000 (Page F-3)

Current Year Inventory: $42,887,000 (Page F-3)

Previous Year Accounts Receivables: $355,000 (Page F-3)

Current Year Accounts Receivables: $485,000 (Page F-3)

Previous Year Accounts Payables: $29,915,000 (Page F-3)

Current Year Accounts Payables: $49,549,000 (Page F-3)

Next, we take this data and plug it back into our formulas.

In this case we can see that Blue Apron had a cash conversion cycle of negative 6.4 days. 

Public Retail IPOs

One interesting way to understand the dynamics of cash conversion cycles is to look at the metric across various types of retail companies. 

Below I compiled the CCC of 17 eCommerce and retail companies at the time of their IPO. As you can see, there’s a wide range: the lowest being negative 163.8 (Blue Nile) and the highest being 152.5 (Canada Goose). Let’s dive into a few of them to understand the mechanics. 

Subscribe to Napkin Math Premium

We’re striving to make Napkin Math Premium the best possible resource for finance and investing analysis. When you become a member you’ll get additional in-depth articles only available to subscribers, including:

Napkin Math also comes as a bundle, so when you subscribe you also get access to all our other paid newsletters: Divinations, Superorganizers, Praxis, Means of Creation, Ask Jerry, The Long Conversation, Free Radicals, and Almanack.

Read this next:

Napkin Math

Live Fuller, Not Bigger

You must escape the shallow joy of more

10 Oct 26, 2023 by Evan Armstrong

Napkin Math

How I Use ChatGPT (As A Reasonable Person)

My AI awakening

8 Nov 30, 2023 by Evan Armstrong

Napkin Math

The Case Against Sam Altman

The board is bad at their job, but they may not be crazy

2 Nov 21, 2023 by Evan Armstrong

Chain of Thought

🎧 ChatGPT for Radical Self-betterment

Clinical psychologist Dr. Gena Gorlin’s AI-powered annual review and goal-setting session

Jan 31, 2024 by Dan Shipper

Napkin Math

Crypto’s Prophet Speaks

A16z’s Chris Dixon hasn’t abandoned the faith with his new book, 'Read Write Own'

13 Feb 1, 2024 by Evan Armstrong

Thanks for rating this post—join the conversation by commenting below.

Comments

You need to login before you can comment.
Don't have an account? Sign up!

Every smart person you know is reading this newsletter

Get one actionable essay a day on AI, tech, and personal development

Subscribe

Already a subscriber? Login