When the media covers companies created by technology, names like Apple, Uber and Slack come up. But what usually doesn't get covered is that behind a new generation of SaaS and social apps is a new generation of infrastructure tools and services that support them. You may not know what they do, but companies like Elastic, Fastly and Crowdstrike are just as important to the tech ecosystem as the ones you interact with every day.
We saw the same pattern in the growth of the industrial economy.
Consider the chicken breast on your plate for dinner at night. In order to get the chicken from egg to oven, an entire supply chain had to be created. Feed production, feed storage, chicken production, transportation, cold storage, cooking, packaging, retailing and disposal — there are billion dollar companies at each step.
The information economy works in the same way. In service of producing and maintaining software applications, billion dollar companies have been built to:
- Accept online payments
- Secure data
- Help engineers debug code
- Enable users to login across applications
- Load images and videos faster
- Digitally collaborate
- Manage devices remotely
And many others. Though few of these touch the end consumer, they are big business. And Datadog is one of these software infrastructure companies.
Specifically, Datadog monitors technology infrastructure and is used to prevent and react to technology outages or failures. If a user sees an error message or can’t use your software, that’s a huge problem. It needs to be solved quickly and efficiently: find the bug, make the change, and ship it across the system. Datadog helps companies do that.
Datadog built software that tracks and monitors metrics, logs and traces for a system. Metrics are a numerical representation of data over a time period. An example might be the response time of a webpage. Logs are records of discrete events. Metrics can be made up of logs, but log data is more granular. It’s used for more detailed debugging. Traces are a series of events that are causally related and make up the end-to-end flow of a request through a system. It’s the path from when a user does something (like click play on a video or message their friend) and how that action moves throughout the technology stack.
Once Datadog collects all this data, they display it in a consolidated dashboard; a single pane of glass, if you will. It’s easy for everyone to see how the system is performing -- from developers to business analysts and everyone in the middle. Their product integrates across hundreds of different data sources, alerts users anytime a metric is outside the normal range, and makes it easy to identify the root cause when a problem surfaces.
You might be thinking, hasn’t this always existed? Datadog was founded in 2010 and launched their first product in 2012. Yet, we’ve been building software for decades. Why have they done so well?
There are two reasons: market and product.
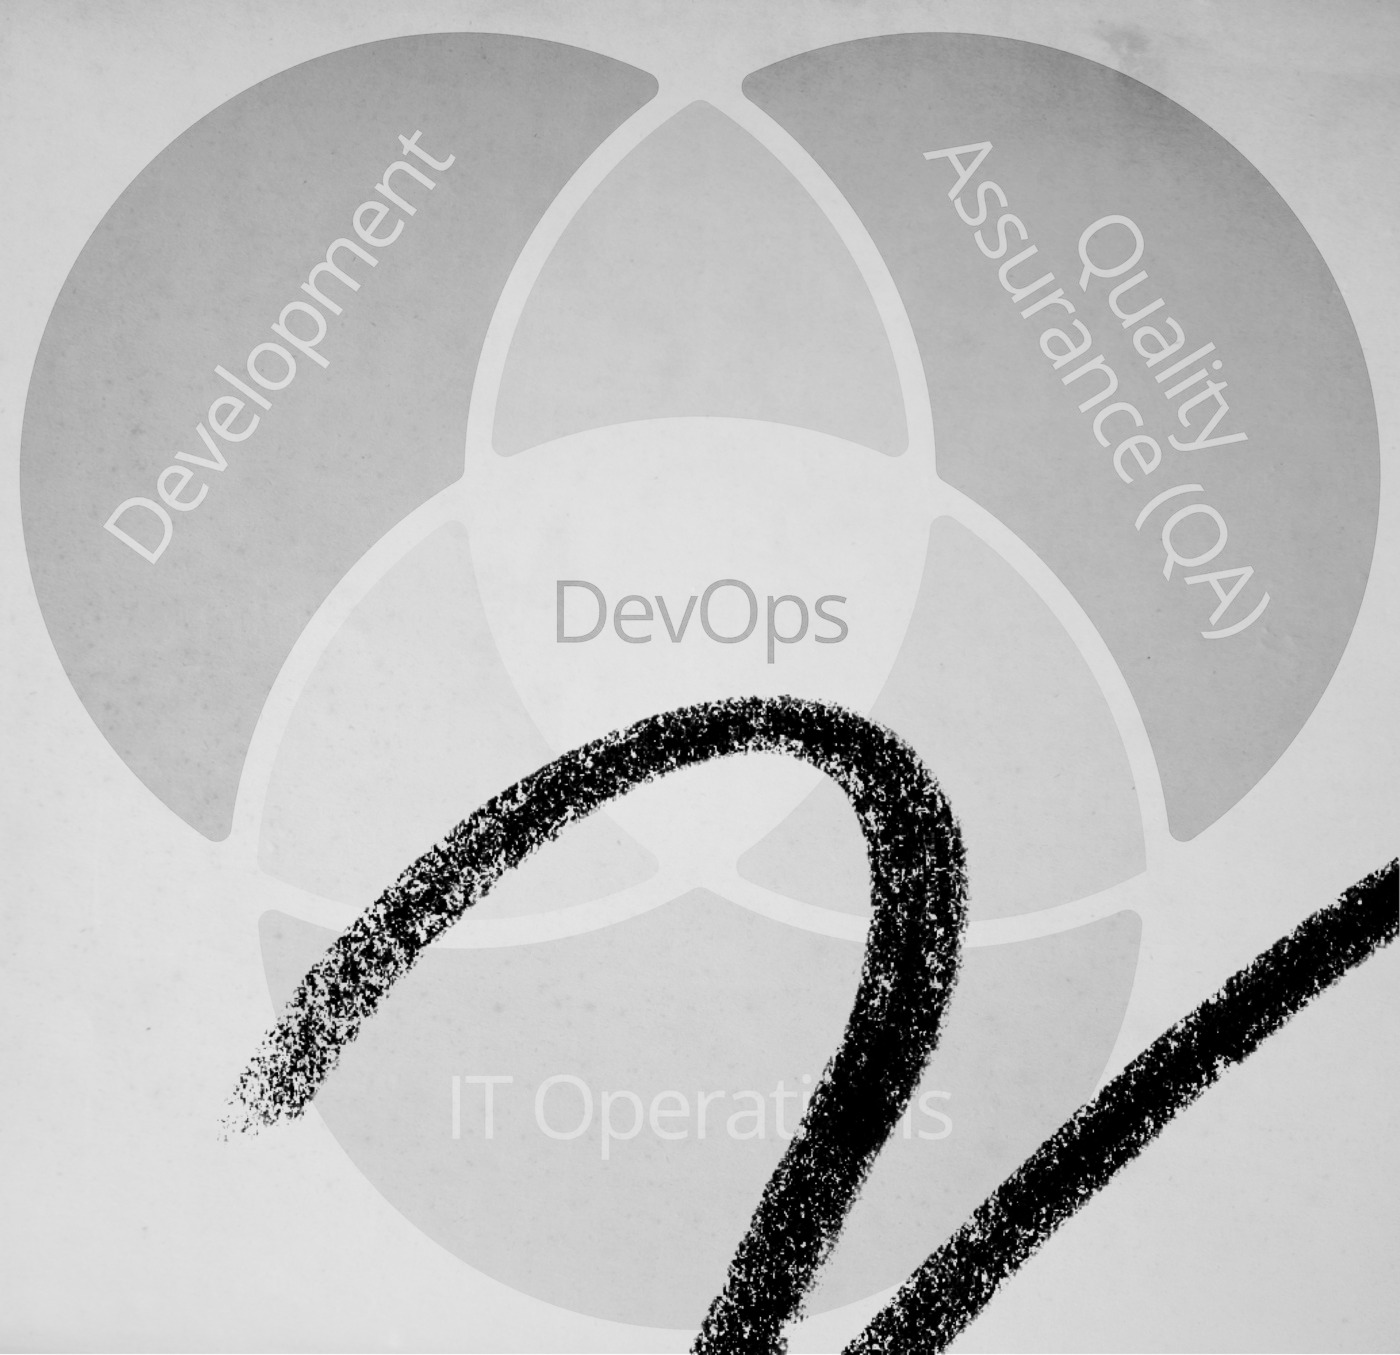
Datadog was in the right market at the right time. In the early 2010s, cloud computing proliferated. With it came two trends that fit Datadog’s strategy. Development and operations teams merged in corporations (“DevOps”) and thus a broader range of people needed to view infrastructure analytics. And the other trend was the increased use of microservices, containers, and serverless computing. This increased the complexity of the software stack and demanded a full “observability” solution. Datadog replaced software that was either built for the on-premise computing environment or was only a single-point solution in the cloud.
But it wasn’t just the market. Datadog saw that the cloud was the future and that the increased complexity demanded a single, consolidated solution. Horizontal, not vertical. Their product strategy, pricing strategy and business model all came from this thesis. They lead with an infrastructure monitoring product, then built out APM and logging to round out the “three pillars of observability.” The past two years they’ve launched an additional five products which have seen great early traction.
Datadog has been one of the best performing SaaS companies in the world. They were built by developers, for developers, and sold in a way that developers loved (e.g., not sold to at all). Datadog has incredible bottoms-up sales motion which has resulted in dollar based net retention of at least 130% for ten straight quarters.
And while Datadog spent the past several years leapfrogging ahead of their competitors, other monitoring software has become more comprehensive. Splunk and New Relic are just two examples of point solutions that have matched Datadog’s suite of products in the past couple years. Despite their incredible success to date, Datadog’s future as a stock is far from certain.
Let’s dive into the details.
Cloud Computing
In 2006, Amazon launched Amazon Web Services. And with it came a better way of creating software. From a post I helped write about Rackspace:
It was the first large and accessible cloud computing platform. This seminal moment changed the enterprise landscape: before the cloud, businesses had in-house server hardware, software licenses, and a slew of IT professionals to manage it all. This on-premise infrastructure was inflexible and expensive. Cloud adoption made software architecture more flexible, cheaper to maintain, and easier to scale up and down.
An obvious win for cash-strapped early-stage startups, the cloud also benefited big businesses. Building on the cloud had several benefits. One of the main advantages of cloud computing is turning a fixed cost (pay upfront for physical data centers) and moving it into a variable cost (pay-per-use cloud computing). It also allowed employees to access company servers from anywhere, thus making them more productive (not just in the work-from-home sense, but also because it allowed for version control and access to lower-cost labor). Finally, the cloud ensured companies operated with best-of-breed infrastructure. It's not an easy technical problem to manage distributed information systems, let alone keep up-to-date on the cutting edge of computing technology. As a result, many companies have outsourced the headache, facilitating more robust and complex solutions.
Cloud computing enabled a better infrastructure environment. Not only could companies only use the computing resources they needed, but further specialization across the ecosystem meant there were more services than ever before.
DevOps and Observability
Cloud computing had lots of downstream effects, but Datadog benefited from two in particular. The first was the premise that development teams and operations teams would merge. Historically, developers wrote the code, while operations personnel maintained the code. They were separate jobs and separate teams.
Datadog CEO Olivier Pomel does a good job of explaining the history of these teams and how cloud computing brought them together (source):
DevOps is a new way of doing things basically that collapses what used to be different worlds. Development: developers are the ones who write the applications and the code, and Operations: that used to be people who build servers and rack them and pull the network cables, that sort of thing. They used to be very separate. The developers build the application and they throw it over the fence to operations people who are responsible for it in production and historically those two teams hated each other.
So the starting point for Datadog was that there must be a better way for people to talk to each other. We wanted to build a system that brought the two sides of the house together, all of the data was available to both and they speak the same language and see the same reality. It turns out, it was not just us, it was the whole industry that was going this way.
This DevOps movement was a core part of the cloud migration that was just starting to take place when we started Datadog, in the early 2010s. A lot of the value prop for the cloud was that, instead of having a development team that builds an application and then you spend 6 months filing tickets and placing order forms in order to actually bring that application into production, and you can’t change your mind for three years on the way it’s going to run… with the cloud you can actually decide on the spot and do whatever you want, engineers and developers can do it themselves without needing to ask for permission, or file a form. And then you can change your mind from one day to the next. That really brought the developers and operations teams together, and that was a bit part of the DevOps movement.
The second trend is observability. Spurred by cloud computing (and a core thesis for Datadog’s product), observability is the monitoring, alerting and maintenance of technology infrastructure and applications. Datadog’s thesis was twofold. First was that every data type and source would need to be on one consolidated view. If a problem arose, you didn’t want to be frantically switching between dashboard to identify which of your data sources contained the context for the problem.
The second thesis is that everyone in the organization — from engineers to business analysts to department heads — would need to be able to access this information. Continuous delivery in software meant that software engineers would now be responsible for the performance and reliability of their applications. Higher-level managers and business employees also would need access to this data.
This bet on a horizontal platform was a big reason why Datadog was able to jump ahead of competitors (who offered point solutions). Splunk had industry-leading log analysis and New Relic had the best APM and tracing. But Datadog was the first to bring those together — log analysis, APM and infrastructure monitoring — into one single product.
Product Development
But the market alone wasn’t enough to propel Datadog to a $12 billion valuation. Their product was carefully thought out at each step.
In 2012, Datadog launched their first product: infrastructure monitoring. Infrastructure monitoring monitors all of the technology below the application layer. For example, an infrastructure monitoring dashboard might display the strain on the underlying hardware (disk space, CPU, memory, etc.). Or it might show how long it takes for a pixel to change from one color to the next on a display. It could also look at broader network connections like the relationship between every server and database in a network.
Datadog’s infrastructure monitoring spanned all environments (on-premise, public cloud, private cloud) and allowed the customer to view all of their metrics on one screen. They were one of the first to build an infrastructure product for the multi cloud environment.
In 2017, Datadog launched their application performance monitoring (APM) product. APM products measure data directly related to the software application. For example, you might measure how quickly an item is added to an eCommerce store. It could also identify error pages or broken links.
When Datadog launched their APM product, there certainly were other APM products available. But Datadog’s product was unique because they already had infrastructure monitoring that was built for the cloud. This was an advantage over New Relic, for example, who had trouble with updates that ran on new servers. From Software Stack Investing: (source)
By building their infrastructure solution for the dynamic and ephemeral nature of cloud hosting, Datadog solved a major problem with existing APM solutions, like New Relic. These were designed around the assumption that servers were generally static instances tied directly to physical hardware in a data center. New Relic didn’t adapt well (at least initially) to context in the cloud, where each customer release could generate a new set of application servers.
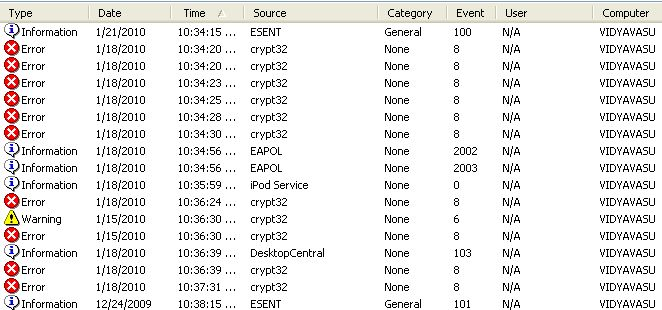
In 2018, Datadog launched their log analysis product. Event logs are passively created throughout the technology infrastructure and often include a timestamp and structured data related to the event.
Example of event logs. Source
They are most often used during debugging when a developer needs extremely granular data to understand the root cause of the problem. Under healthy circumstances, metrics that summarize the performance of infrastructure are sufficient to understand the health of a technology stack. But logs provide a level of detail that’s important when something goes wrong.
Datadog’s logging product was very disruptive to the industry (particularly to Splunk, the leading incumbent) due to Datadog’s unique pricing structure. Previously, Splunk had charged customers based on the amount of logs ingested. So as your technology usage increased, and that technology automatically generated logs, it would rack up a higher and higher Splunk bill.
But there was real value to ingesting every log. Even though it would be cheaper, it wouldn’t make sense to ingest only 50% of your logs, for example. There are use cases, such as troubleshooting or security audits, where having all of your log data is critical. But with Splunk, it was prohibitively expensive to pay a high price to ingest all of it all of the time.
Datadog’s pricing filled the market gap. With Datadog, customers could pay a very low price to ingest and archive all of the logs and only pay a higher price for the data that they analyzed. It allowed customers to pay for what was important but still have a backup of the more mundane data. Datadog’s logging product has been a key growth driver for Datadog the past two years.
Overview of Datadog’s logging product
End of Datadog’s Reign?
Datadog’s success is a right place, right time story, backed by exceptional execution. They built a cloud-first mission critical solution right at the beginning of cloud migration. They built bottoms up — serving developers directly — and continually launched products which have led to some of the highest net retention rates in the industry.
However, many of their advantages came from being first to market. Splunk, previously focused on logging, acquired SignalFX in 2019 which rounded out their observability platform. New Relic spent several years developing New Relic One. And while that investment depressed their share price in the short-term, they now have an all-in-one platform that directly competes with Datadog.
Datadog CEO Olivier Pomel has mentioned that “somewhere around high single digits to low teens percent of workflows have moved from legacy IT to cloud,” meaning that they face no competition for many of their new customers. With these new competitors, this is going to change. It’s just a matter of time.
If there’s a competitor that I’m most worried about it would be New Relic. Their stock hasn’t performed well because they spent years investing in product as they caught up to Datadog. But in addition to a full observability offering, New Relic’s software is also programmable. Developers can use their data and APIs to build custom apps right on top. If these apps serve to be useful, New Relic could position itself as a better observability platform than Datadog in the long term.
On the other hand, in the past two years Datadog has released a fleet of new products including Synthetic Monitoring, Real User Monitoring (RUM), and Security. Maybe they can maintain their market-leading position and expand into other parts of the enterprise. If the “single pane of glass” thesis was true about development and operations, perhaps it also applies to security.
Either way, technology continues to work it’s way through our economy and cloud computing is the backbone of that trend. There is room for lots of winners in infrastructure, and regardless of how well the stock performs, Datadog is one of the best case studies in infrastructure SaaS.
Thanks to Guru Chahal, Jesse Beyroutey, and Sunny Juneja for insightful conversations around this topic.
The Only Subscription
You Need to
Stay at the
Edge of AI
The essential toolkit for those shaping the future
"This might be the best value you
can get from an AI subscription."
- Jay S.
Join 100,000+ leaders, builders, and innovators

Email address
Already have an account? Sign in
What is included in a subscription?
Daily insights from AI pioneers + early access to powerful AI tools


.08.31_AM.png)


Comments
Don't have an account? Sign up!