Tech stocks’ favorite lie to investors

How the LTV/CAC ratio is manipulated to take advantage of retail investors

As a four-eyed nerd who spends my weekends analyzing businesses for fun, I was excited to see the Warby Parker S-1 drop. During my first read, I was having a great time. There were customer cohorts! Quips about how screens made our eyes rot and would increase their market size! Their average sales per square foot! (less cool but for the rule of threes I needed another thing to list). It was a veritable menagerie of business nerd dopamine hits. 

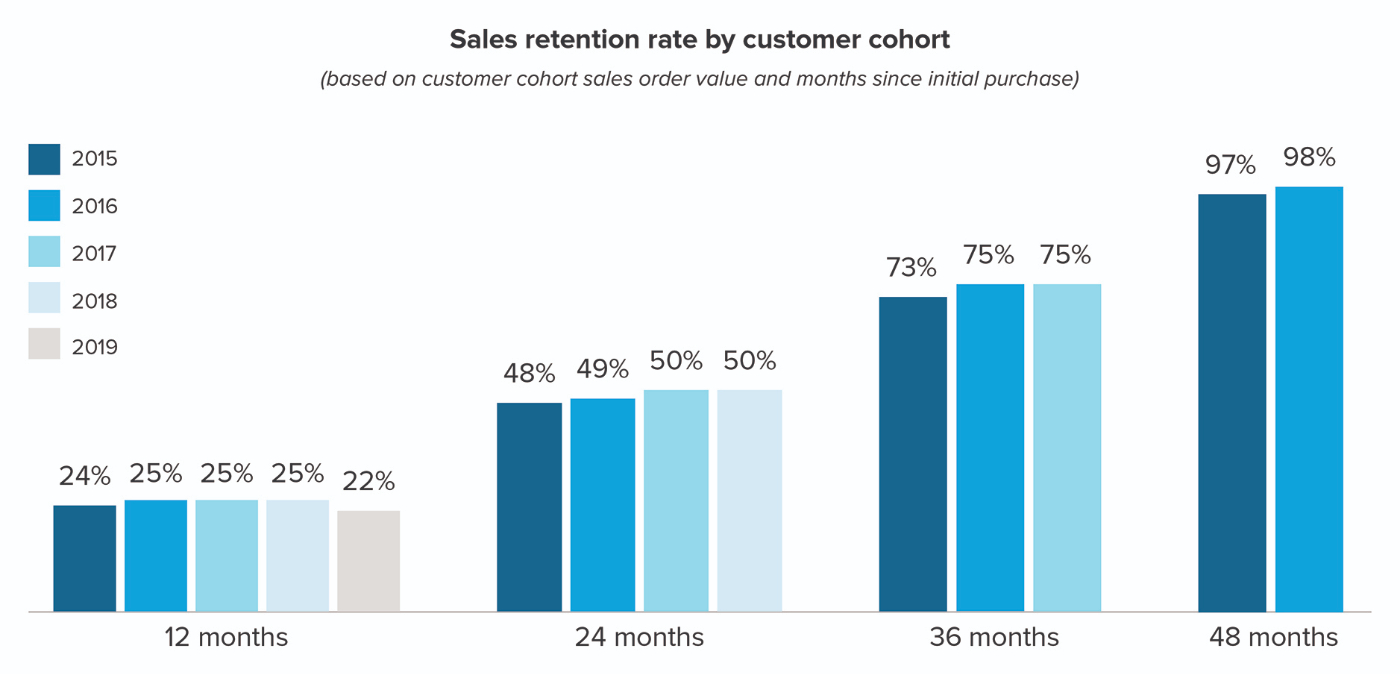
One of the more impressive numbers was their customer acquisition cost (CAC). Pre-Covid they bragged a ~$27 CAC. Coupled with some best in class retention, this looked like a highly efficient growth machine, if you squint. 

Thankfully I had just gotten a new prescription (not fulfilled by Warby Parker) and saw something funky in how they defined acquisition costs. Rather than focusing on acquisitions of new customers, they blended it with the acquisition costs of all their repeat customers too! By allowing existing customers to count towards this metric, they significantly decreased what their “CAC” was. The real CAC, the one that actually matters, will be higher. 

Any savvy investor will note this and build it into their assessment of the stock. But for retail investors who lack the skills/time, they will miss this and get taken advantage of. 

Warby Parker is not the only sinner here. Recently, Figs (a clothing retailer) did the exact same thing in their S-1 back in May of this year. Their fib was identical by including repeat purchases and not just new customers into their CAC. 

This behavior is mummery, an act, a falsification. 

But the thing is, this isn’t unusual. In fact, companies lie in their SEC filings all the time. It’s an accepted part of the game. 

And frankly, it pisses me off. 

So today, we are once and for all showing exactly how the metrics used to define the Lifetime Value of Customer work, how to measure the acquisition costs to acquire a customer, and what good performance looks like.

Importantly, we’ll also show the common tricks that companies will pull to deceive people. 

To do this, I teamed up with my good friend Spencer to tackle this issue. He is the perfect person to work with on this topic, having spent a few years at McKinsey advising major corporations on their growth, then owning the growth model for Stance Socks, a company doing $100M+ in top line revenue, as their director of growth, and now advises startups on growth as an Associate at Upfront Ventures. Thanks to him for his time/effort/friendship. 

We will start with the value a customer brings in, Lifetime Value (LTV), because knowing the money they bring is the first step so you have something to weigh the acquisition cost against. 

The Fun Side of the Equation

Business managers want nothing more than predictability for the unit they are running. The more acutely you can know what the future will look like, the better you can risk-adjust your activities. People have tried all sorts of things to know the future. I’ve met Vice Presidents who wear the same underwear the entire week of quarter close (seriously). Some turn to Tarot, some to Astrology, but most rely on the magic of spreadsheets to calculate reassuring futures.

Lifetime Value (LTV) is one the best cards by which to see the future. It is a calculation that tells you how much money a customer will contribute to your business over their course of their time interacting with you. 

But just like there are scammers at Carnivals with Tarot cards, there are unscrupulous finance teams who like to cut the deck in their favor. 

A few of the favorite tricks include:

  • GMV only: When a retailer sells someone else’s goods, they technically will have the entire revenue of the product pass through their financial documents. Companies will sometimes argue that the GMV is the actual value (it most definitely is not) 
  • Pure Revenue: Even for companies that aren’t retailers, they will try to argue that you shouldn’t consider the profitability of a customer because margins will change. WeWork is the biggest sinner on this one, but it is still fairly common. Usually it is an artifact of a finance team that built their first LTV formula when a startup was young and they didn't want to update their assumptions.
  • All Cash Upfront: Revenue recognition does play a role here. How LTV factors in the balance between monthly, annually, and multi-year contracts is mega complex. There is never really a way for an investor to test for this fib unless you get direct access to their entire accounting system. 


Best practice is to make the gross margin the focus of your analysis. Because companies are in the business of making money *shocker* and you want to know, after accounting for the cost of goods sold how much is left over to do things like pay people’s salaries. 

The exact method of calculating LTV differs based on the business you are operating, but in broad strokes, the correct method is dependent on if a company is a recurring revenue or non-recurring revenue business.

For a recurring revenue business it is honestly easier! The formula is a simple: Average revenue generated per user per year * the length of time that a customer sticks around.

But even in this simple case, you’ll see people fudge the numbers. I chatted with a CFO once who said they had a 15 year lifespan because their customers had used Microsoft Office for that long. (Wrong). 

The actual way to do it is using a churn rate. Churn rate is: Number of Customers at the Beginning of a Period - Number of Customers at the End of a Period Divided by the Number of Customers at the Beginning of the Period. 

For non-recurring revenue business, it gets a little more complicated. The formula is LTV =  Average Order Value * Repeat Purchase Rate * Gross Margin

In contrast from the example above, churn is kinda sorta illogical in the context a non-recurring revenue business. What is an active customer for a Nike? If you haven’t purchased a pair of Jordans in 11 months, are you still considered active or have you churned? Note: This is another fib you will see lots of in direct to consumer startups. The expected purchase rate will be inflated or deflated depending on what kind of narrative the finance team is trying to spin. 

For non-recurring revenue businesses, it is easier to look at historic cumulative spend by cohorts to get a sense of where spending is tapering off. If you have enough data, this ceiling can function as a good place holder for LTV. 

If you do need to make an assumption about how long a customer will be around, look at the repeat purchase rate of your oldest cohort. Note: Purchase age, not literal age. Quit being pedantic. 

You then check to see how cohorts more recently acquired compare to the trajectory of the older cohorts. Is the average order value trending higher? Is repeat purchase rate consistent, improving, or getting worse? There is no one right answer so be conservative with your estimate.  


(Link here if you want to play with the model yourself)

Calculating LTV should be a slow affair—take the time to feel the contours and flow of customers in your business. It is much more a case of playing Battleship and triangulating the LTV location versus doing a simple math equation. 

Congrats! You can now predict the future and will have skills that makes MBAs feel like you are a dark finance wizard. There are entire classes at college devoted to figuring this out and you just got the knowledge for 20 bucks a month. Not bad!

Once you know the future value a customer can bring you can understand the context for the costs associated with acquiring them. 

The Sad Side of The Equation

Cost per acquisition would appear to be straightforward. It is simply how much money do you have to spend to get one additional customer. But because the definition is flexible, you’ll see companies fib with this number all the time.

This usually manifests itself by the superfluous ignoring of various costs:

  • Paid Channels: We’ve only seen this once, but there was a startup Evan looked at that didn’t include Facebook ads as an acquisition cost. (This was not right).
  • Brand Campaigns: If you are running ads promoting your market positioning the cost should be included in your CAC. Top of funnel ads, even the ones not directly attributed to a purchasing decision, need to be included. 
  • Marketing Salaries: The smart, good looking professionals in marketing are a cost center that should be distributed evenly among customers. Note: The not smart people should be included too. 
  • Sales Commissions: If your product is reliant on sales staff to convert leads into customers, include their cost in the CAC. Customer Success will sometimes be included here too. This one is still up for debate but Napkin Math recommends including the initial set up costs while not including support costs beyond initial implementation. 
  • SaaS Tools: Whether it is a marketing platform like Hubspot or customer data platforms, if your acquisition is reliant on a specific tool, include it. 

The formula is pretty simple—you just add these all together per customer and you have your CAC! Don’t say I didn’t ever give you anything easy to do. 

An important thing to note: this shouldn’t just be one static number! Once you add all of these in, you’ll want to undergo a similar contour exercise that you did with LTV. Run calculations by channel of acquisition and month of acquisition, the same cohorts as above for LTV, so you can generate a LTV:CAC ratio for each cohort and track cohort performance.

All of these fibs happen in both public and private companies. The SEC does not regulate public companies' definitions of LTV or CAC so companies will adjust their composition all the time. Startups will fib this so much that many investors will sit down with the CFO privately and ask lots of clarifying questions. I’ve heard of some growth funds asking for direct access to companies' Stripe accounts so they can do the calculations themselves without the company's interference. 

But let’s assume that you find an honorable company that does all this right. They’ve run the math, built the cohorts, and have spit out a number. How are you to judge that? 

The Answer to the Equation

You can think of the answer in 3 broad buckets. 

LTV:CAC < 1 - For every dollar you put into the marketing growth engine, you aren’t covering your COGS and marketing cost. You would have been better off keeping the money in your bank and just covering your other operating costs. Again, this is because it accounts for ALL future spend. You aren’t treading water, you are sinking.

LTV:CAC = 1. For every dollar you put into the marketing growth engine, you get one dollar out to cover costs of operating. You are treading water and going nowhere. You are just as well off keeping that $1 in your bank and using it to cover your burn. 

LTV:CAC > 1 For every dollar you put into the marketing growth engine, you get at least $1.01 out.

There is no hard and fast rule, but in general, you will see a 3:1 LTV/CAC ratio considered “good.” The real determining factor here is opportunity cost. So let’s suppose you’re the CEO and you just raised $15M. You know your LTV/CAC is 3:1, so you are in that green zone. How much can you allocate to marketing? Should you put all of your growth dollars to work in marketing? Could you if you wanted to? 

The Law of Diminishing Returns

Dread it, run from it, Econ 101 comes all the same for business practitioners.  Marketing performance is highly contingent upon The Law of Diminishing Returns. Diminishing returns show that for each incremental unit you put to work, the marginal return from that unit is lower. In the graph below, If you put in one unit, your output increases by nearly 2. If you put in a second unit of labor, your output increases about 1. Third unit, up 0.5. And so on.

Because of the law of diminishing returns, you can’t pour money into a specific marketing channel forever even if you have a great LTV:CAC ratio today. At some point, that ratio will decline below the level you are comfortable with, at which point you would prefer to allocate dollars into another growth opportunity. 

You are probably (and rightfully thinking) “cool, but this is highly academic. How do I know how much I should actually spend? I’m not going to create a diminishing returns graph and plot out exactly where I forecast the budget and corresponding CAC to go.” 

And you’re right! The reality is these decisions are messy and opaque. You don’t have perfect information or know the exact opportunity cost of investing a dollar in marketing vs. elsewhere.

Spencer recently saw a portfolio company do something really smart to approach this challenge. They built a sensitivity table of marketing spend and CAC, and populated each cell with the revenue and profitability potential from the corresponding CAC and Marketing Spend. Then they plotted where they are today, and compared it with the feasibility of moving to another desired quadrant on the matrix.

The result would look something like this. 


(Link here if you want to make a copy and play with it yourself)

You can use this analysis to answer questions like: what is an acceptable range? Where is the danger zone? What is a CAC we would be okay with? Where would that put our LTV:CAC ratio?

Ideally, a growth team will have an estimate of where CAC will go with each increased increment of spend, but the only way to figure this out is to test it. A common test is temporarily ramping up spend in a channel for a period of time to see how CAC and return on ad spend are affected. Having transparency around what is an okay CAC based on current LTV will help you make intelligent decisions about scaling your business.

The real world is messy, there is never enough time to actually run all this analysis constantly. But the goal for today was to give you a good enough understanding that you would be able to see (Warby Parker call back!) the shape of this math clearly. A well-understood CAC/LTV ratio empowers teams to make smart decisions about where to invest their capital. Investors can use the same metric to see what teams they should invest in. 

Till next week, 

e

Like this?
Become a subscriber.

Subscribe →

Or, learn more.

Read this next:

Napkin Math

Live Fuller, Not Bigger

You must escape the shallow joy of more

10 Oct 26, 2023 by Evan Armstrong

Napkin Math

What Are AI Agents—And Who Profits From Them?

The newest wave of AI research is changing everything

6 Mar 28, 2024 by Evan Armstrong

Napkin Math

The Cost of Greatness

What will be the blood sacrifice on your altar of ambition?

2 Jun 1, 2023 by Evan Armstrong

Chain of Thought

Transcript: ChatGPT for Radical Self-betterment

'How Do You Use ChatGPT?’ with Dr. Gena Gorlin

🔒 Jan 31, 2024 by Dan Shipper

Napkin Math

Profit, Power, and the Vision Pro

Will Apple’s new headset change everything?

5 Feb 6, 2024 by Evan Armstrong

Thanks for rating this post—join the conversation by commenting below.

Comments

You need to login before you can comment.
Don't have an account? Sign up!
@vishalchandra over 2 years ago

How does churn rate factor into LTV calculation? Would have been nicer to share a list of formulas somewhere.

Also how to know Warby's real CAC ? Is it possible to estimate that in some way?

You left out the answers from the post.

Every smart person you know is reading this newsletter

Get one actionable essay a day on AI, tech, and personal development

Subscribe

Already a subscriber? Login