Sponsored By: Lemmy
This essay is brought to you by Lemmy, your AI super assistant for work. Imagine being able to connect all your tools like Google Docs, Notion, Github, and Slack, and retrieve information at the speed of chat, this is what Lemmy does. Streamline access to your company's data and turbocharge your workflow with Lemmy.
10-second summary:
- In an apparent contradiction, the internet both fragments and concentrates attention.
- The reason for the former is intuitive: more stuff, less attention per unit of stuff. The reason for the latter is not. It happens because networks are subject to powerful positive feedback loops. On a network, people’s choices are influenced by others’ decisions, amplifying “hits.”
- There are two underlying mechanisms: information cascades (when people treat others’ choices as signals of quality) and reputational cascades (when people conform with the group decision). As choice has exploded on the Internet and it has become easier to both observe others’ choices and share your own, these mechanisms have become more powerful.
- Consumers also rely heavily on recommendation algorithms to make choices, intentionally and unintentionally. Depending on how they’re constructed, these systems can either boost or dampen the social signals arising from the network.
- The result is that the distribution of consumption in almost all media persistently, and in some cases increasingly, looks like a power law: a few massive hits and a very, very (very) long tail. I provide a framework for thinking about the “extremeness” of the distribution and show a few examples: box office, Netflix original series, Spotify streams, and Patreon patrons.
- There are a number of important implications for media companies. The good news is that there will likely always be big hits, even in a world of practically infinite content. The bad news is just about everything else: the lucrative middle is being hollowed out; the randomness—and therefore risk —in producing hits is climbing; the tail is become more competitive for hits; more economic rent will likely shift to talent; content producers are increasingly at the mercy of curators’ algorithms; and paid media is being devalued.
Almost 20 years ago, Chris Anderson published The Long Tail, which accurately predicted that the Internet would fragment attention and consumption would shift into the “tail.” But Top Gun: Maverick generated over $700 million at the domestic box office, Bad Bunny had 18.5 billion streams on Spotify last year, and 142 million households reportedly watched Squid Game in its first 28 days. Why are there still hits in a fragmenting world?
Imagine hiring an AI executive assistant, who understands your tools and workspace like a seasoned pro. Welcome to Lemmy - your ideal coworker! Lemmy syncs with your daily tools like Google Docs, Slack, Notion, Meta Ads, and GitHub, and even supports web browsing.
Instead of wasting precious hours digesting long threads or documents, let Lemmy summarize them and catch you up to speed. Save time with content creation by starting your work and letting Lemmy autocomplete it. Let Lemmy's analytical skills take over managing your Facebook ad spends or conducting diligent SWOT analysis.
Step into the future of productivity with Lemmy.
I obsessively think about the future of the media business—I’ve been in and around it for almost 30 years, including about 15 years as a Wall Street analyst and 12 years at Time Warner, where I headed investor relations and held a variety of strategy roles. I recently published an essay about what I call “infinite TV,” in which I made the case that over the next decade, video will follow the path of text, photography, and music, and the quality distinction between “professionally-produced” content and “independent/creator/user-generated” content will increasingly blur. The result will be a practically infinite amount of quality video content. Will there still be hits then, or only personalized niches?
Have you ever wondered why so many blockbuster movies are about superheroes? Is Hollywood lazy, or are consumers’ tastes becoming dumber and more homogenized? Or neither?
Why does something go viral, anyway?
Do content recommendations push you to the most popular shows, movies, and songs, or are they tailored just for you? Or do they have a different agenda?
Will web3 really be the savior of small creators?
When Billie Eilish, Lil Nas X, Mr. Beast, or PewDiePie emerged from obscurity, was it inevitable that their talent would be recognized—or just luck?
Are the top-rated reviews on Amazon or answers on Quora the most helpful?
All of these questions are about the distribution of popularity. The same phenomenon underlies the answers: networks.
In this piece, I explain why power law-like distributions—meaning a few massive hits and a vast number of misses—are an inherent feature of networks; describe how recommendation systems can either dampen or reinforce social signals; show some examples of the persistence of power law-like distributions in media across movies, TV, music, and the creator economy; and discuss why all this matters.
The long tail was half-right
The idea that the internet would cause media fragmentation is almost as old as the modern internet itself. (Or maybe older. The line often misattributed to Andy Warhol that “in the future, everyone will be world-famous for 15 minutes” was a pre-internet prediction of fragmentation.) In 1999, Qwest Communications produced an ad featuring a motel with “every movie ever made in every language” (Figure 1). The Long Tail, published in 2004, argued that because the internet dramatically lowered the cost to store and transport information goods, it would result in practically unlimited shelf space. Faced with far more choice, consumers would shift most of their consumption to the “tail,” heralding the end of mass culture and waning importance of hits. If anything, Anderson underestimated the size of the tail because he didn’t anticipate social media. The tail is not Icelandic synth pop, as it turns out, but an endless amount of user-generated content.
Figure 1. Qwest envisioned media fragmentation 25 years ago
Source: Qwest Communications print advertisement, 1999.That the internet would yield more choice and, therefore, more fragmentation was intuitive then and is indisputable now. But it only tells half the story. Though it seems contradictory, the internet both fragments and concentrates attention.
Understanding those dynamics matters. The contention that there are still hits may seem uncontroversial and certainly feels right intuitively. We know that when Beyonce or Taylor Swift releases an album, or the next season of Stranger Things or Game of Thrones drops, the collective attention of popular culture, much like the eye of Sauron, will be trained on it—at least until the next thing comes along. But understanding why there are still hits provides insight into whether this will persist as the supply of content keeps growing faster than demand.
The internet concentrates attention because it connects everyone in a big network. And networks are subject to powerful feedback loops. Since consumers increasingly both discover and consume content through information networks, their decisions are increasingly influenced by other people’s decisions. These feedback loops amplify the popularity of a small number of choices—hits.
The net result of these opposing forces—fragmentation and concentration—is that media consumption, and culture more broadly, is persistently, and in some cases, increasingly, observing power law-like distributions. Few TV shows, movies, songs, books, video games, journal articles, newsletters, short-form videos, and tweets will be wildly popular, while the vast majority will be hardly consumed at all.
What is a power law?
One of the first statistical concepts taught in school—right after mean, median and mode—is the “bell curve,” aka the normal or Gaussian distribution. The intuition behind a normal distribution is that if you have enough random independent observations, most observations will be relatively close to the average (or mean) and equally distributed on either side of it. Many independent natural phenomena approximate this distribution, especially when the extremes are bounded, like height, weight, test scores, or rolling two six-sided dice.
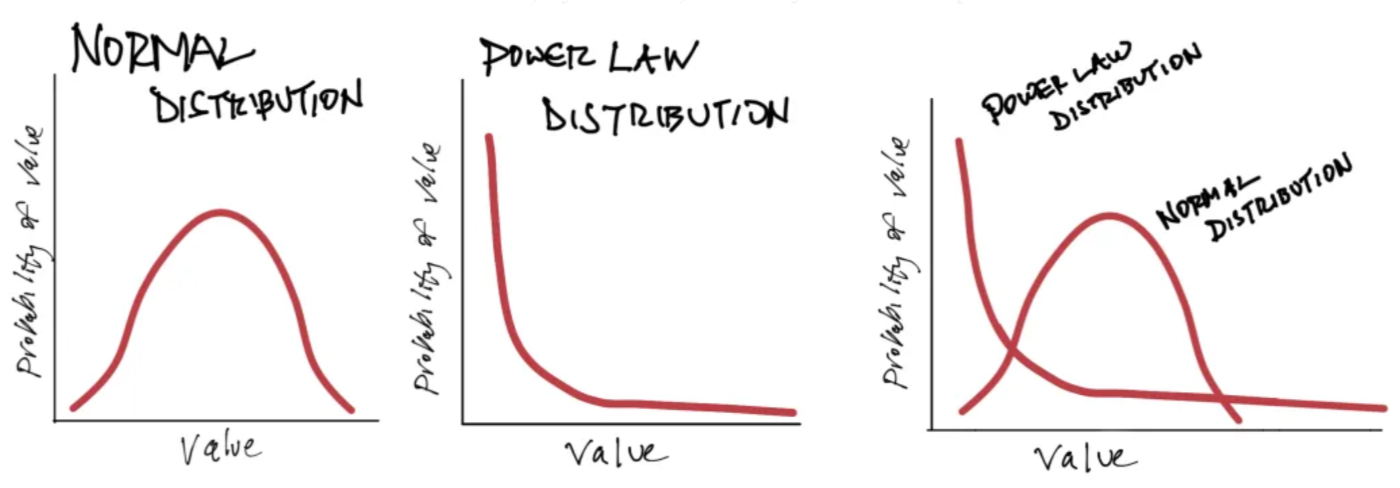
Figure 2. Normal and power law distributions
Power law distributions, by contrast, look different. A power law simply means that the dependent variable is a “power” of the independent variable. For instance, the volume of a cube is a “power” of the length of the sides, because volume increases three units for each one unit in length. Generally, they can be expressed as:
In a power law probability distribution, the exponent is negative, which results in a downward sloping curve (as illustrated crudely in Figure 2). As shown, power law distributions are characterized by a large number of very small observations and a small number of very large observations.
For our purposes, the main point of this comparison is shown in the graph furthest to the right in Figure 2, which superimposes a power law distribution over a normal distribution: the likelihood of both extremely small and extremely large observations is much greater in the former than the latter.
Perhaps the best way of thinking about these differences is a framework popularized by
Nassim Nicholas Taleb in The Black Swan. Think of the world of normal distributions as Mediocristan—a place where everything hovers somewhere around the average—and the world of power law distributions as Extremistan—a place where seemingly extreme things happen much more often.
Why power laws occur in culture: networks
The idea that the internet causes media fragmentation is intuitive, but the idea that it also amplifies hits is not. Let’s explore why that happens.
Power laws (or, strictly speaking, power law-like distributions) show up in a lot of places: the incidence of earthquakes, the occurrence of words in any given publication, the population of cities, metabolic scaling among mammals, and a whole lot else.
The mechanisms behind these power laws are not always clear (there is debate whether power laws are an inherent property of complex systems). But power laws are common in networks because network phenomena tend to be dependent, meaning there are feedback loops. Each node on the network influences, and is influenced by, other nodes.
This is particularly true for popularity. Power law-like distributions are everywhere in media, as engineer Michael Tauberg wrote about.
Social signals influence our choices
If networks tend to amplify hits because people often base their choices on what they see other people do, the next question is: why? For two reasons: 1) it is often rational to assume that other people’s choices contain valuable information; and 2) people care what others think of them.
These are two distinct phenomena, what social scientists call “information cascades” and “reputational cascades.”
- Information cascades. What do you do when you have to make a choice and have incomplete information? It probably depends on how hard it is to determine the quality of your options yourself (“search costs”), as well as the consequences (including the reversibility) of making a bad choice (“opportunity costs”). Search costs are a function of both the number of choices and the time required to ascertain the quality of each choice. For instance, it is easy to quickly judge quality when scrolling TikTok and hard when looking for the next multi-season TV series. The opportunity cost of listening to the first eight seconds of a recommended song on Spotify is very different from getting a babysitter and going to the movies. When search and opportunity costs are low, you may choose to figure it out yourself. When they are high and you can see what other people have done, it is reasonable to presume that (collectively) other people have more information than you do and base your decisions on theirs. When many people do this successively, it results in something called an “information cascade.” This is sometimes called cumulative advantage, preferential attachment or the “rich-get-richer effect,” whereby popular things tend to get more popular and unpopular things stay unpopular.
- Social conformity and reputational cascades. When you can see people’s choices and they can see yours, you may conform, consciously or subconsciously. As a generality, we all feel pressure to conform, as was corroborated by famous social science experiments in the 1950s-1970s. Alternatively, you may intentionally choose to follow the group’s decisions because you want to signal your allegiance and worthiness of belonging, or what is called a reputational cascade.
(There is a third reason that people are often influenced by others’ choices that I’m overlooking: network effects. Sometimes people follow the crowd because they benefit directly from a larger network. This may be a significant factor for fax machines, operating systems, or electric vehicles, but probably has less relevance in culture. The direct benefits of more developers building apps for Windows or more Tesla rapid-charging stations are clear; the network effects from a lot of people watching your favorite TV show or listening to your favorite band are questionable and may actually be a drawback for people who believe they have unique taste.)
Social signals are becoming more important
So, people are more likely to be influenced by what other people do when: 1) there are a lot of choices; and 2) it is easy to observe what other people do.
Both of those conditions have increased dramatically in the last few decades, for a couple of reasons:
- The amount of content available has exploded, making search costs astronomical and increasing opportunity costs. It is obvious that more choice means higher search costs. It also means higher opportunity costs, because when you make a choice today there are many more things you are choosing not to do.
- Owing to online networks, people are much more likely to be influenced (directly and indirectly) by what other people choose. Many people explicitly outsource their content curation to their friends (by relying on the Facebook newsfeed), their hand-selected panel of “experts” (on their Twitter/X timeline), or their favorite celebrities or influencers (on Instagram). But sometimes we forget that elements of social networking are embedded in non-social networking applications, too. Go to the Apple App Store, Amazon, OpenTable, or even look for “restaurants near me” on Google Maps—in every case, you will probably be influenced by other people’s opinions. Most recommendation algorithms also rely in part on collaborative filtering (discussed more below), which is based on the collective choices of a group or subgroup. When you accept an algorithm’s recommendation you are often indirectly influenced by what other people choose, whether you know it or not.
Taken together, this means that today, people are much more likely to base their choices on other people’s decisions. This explains the paradox described at the beginning: while the internet fragments attention, it also causes cascades that concentrate attention.
Recommendation engines can help or hurt
Confronted with so much choice, consumers don’t only depend on the organic social signals they receive from the network; they also rely (to varying degrees, depending on the person and type of media) on recommendation systems. Those systems may amplify or dampen the influence of the network, depending on how they are engineered.
Recommendation algorithms are based on two primary types of models: collaborative filtering and content models. In the former, the algorithm recommends content or products based on what other people have chosen. In the latter, recommendations are based on certain attributes of the content or products themselves.
It is common for these algorithms to include elements of both models. For instance, in its recommendation system Netflix incorporates all kinds of metadata associated with each content asset (director, actors, genre, age rating, tone) and popularity (viewership, completion rates, and ratings) among cohorts it believes are similar to the customer, as well as prior viewing behavior by the customer (device, time of day, time spent viewing). TikTok similarly bases its algorithm on user behavior, collaborative filtering, and specific content attributes, among other things. By contrast, Pandora’s recommendation system is uncommon because it is based solely on content attributes, not on any collaborative filtering.
A simple framework for predicting ‘extremeness’
As mentioned, power law-like distributions are ubiquitous in media, but to varying degrees. Synthesizing the last two sections, I’ll propose a few rules of thumb for predicting when distributions will be more, or less, extreme:
- Higher search costs = more extreme distributions (because people need to rely more heavily on social signals)
- Higher opportunity costs = more extreme distributions (also because people are more likely to seek out social signals before committing)
- Recommendation systems that lean heavily toward collaborative filtering = more extreme distributions (because the algorithm amplifies the social signals)
How do we know a popularity distribution is a power law, and how do we measure “extreme?”
Answering those requires a little more math. As shown above, the general mathematical expression of a power law looks like this:
In a pure power law, c is a constant, which can be thought of as a scaling factor, or the sensitivity of the dependent variable to changes in the independent variable. In a power law distribution, c is also negative, which is why the curve is downward sloping. It can be hard to tell whether this scaling factor is constant just by looking—and therefore whether it is really a power law. An easier way is to convert the data to a log-log plot (which takes the log of both sides of the equation) and determine whether the resulting relationship is linear. To see why, we take the log of both sides of the equation above:
That is a linear function, equivalent to y = b + mx. In other words, if we really have a power law (or something power law-like), the log-log plot should look like a straight line, where the slope is c, and the larger (or more negative) the value of c, the more “extreme” it is. We can also test how straight it is, and therefore whether the scaling factor is really a constant, by calculating the r².
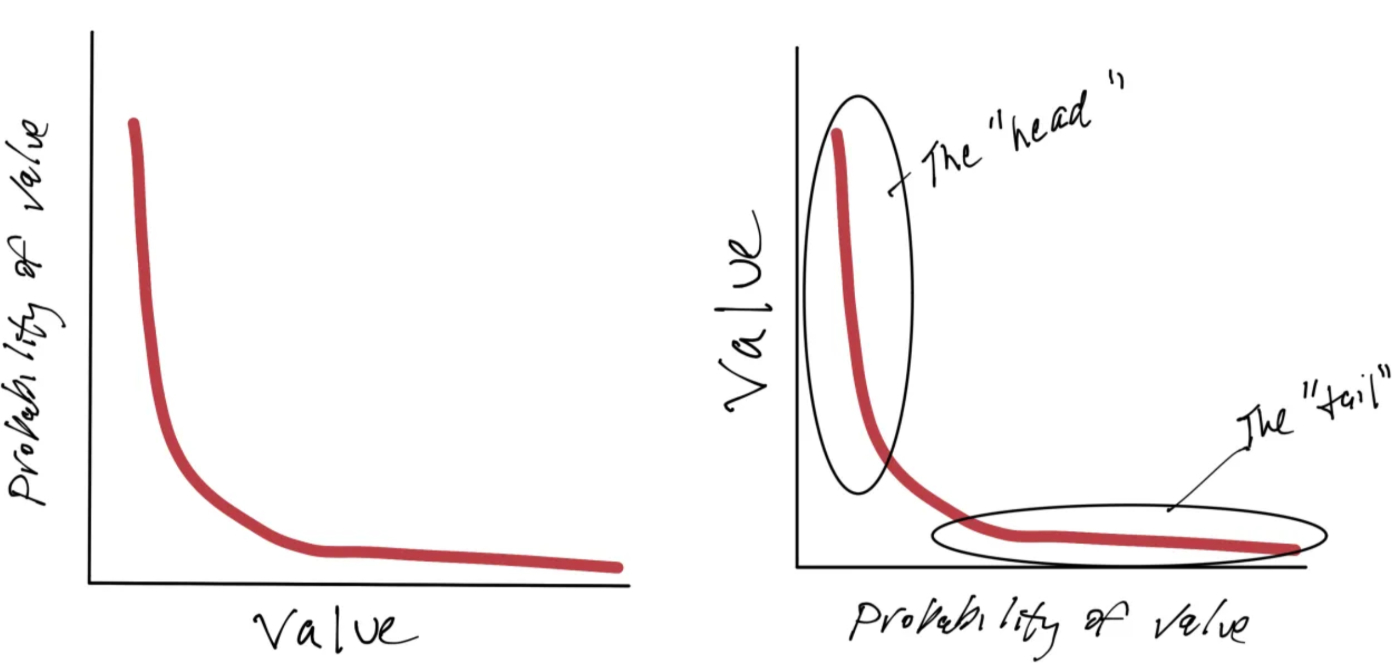
Figure 3. Popularity distributions usually show value as a function of probability (or rank)
A few examples (and caveats) of content distribution
Let’s take a look at some representative distributions of consumption for a few media, over time: box office, TV series on Netflix, streams on Spotify, and Patreon creators.
(Note: in the power law distribution above in Figure 2, the Y-axis is probability and the X-axis is value to better compare normal and power law distributions. A more intuitive and common way to discuss popularity distributions is to flip the axes so that the Y-axis is the value and the X-axis is the probability, which is also a power law [Figure 3]. This shows that only a handful of observations will be extremely large [what is colloquially called the “head”] and a vast number will be very small [the “tail”]. This is how I discuss popularity distributions below.)
This analysis is imperfect, for a few reasons. I would like to have longer time series than I show here (box office is great, at ~20 years, but it would be great to have 20 years of music data, too). Also, the data for Spotify and Patreon only show the distribution of consumption at the head of the curve. Since power laws are self-similar (or “scale invariant”), in theory the distribution at the head of the curve is representative of the entire distribution, but if these are not pure power laws that may not be the case.
Putting those aside, all four of these examples show persistently extreme distributions that closely approximate power laws.
Box office
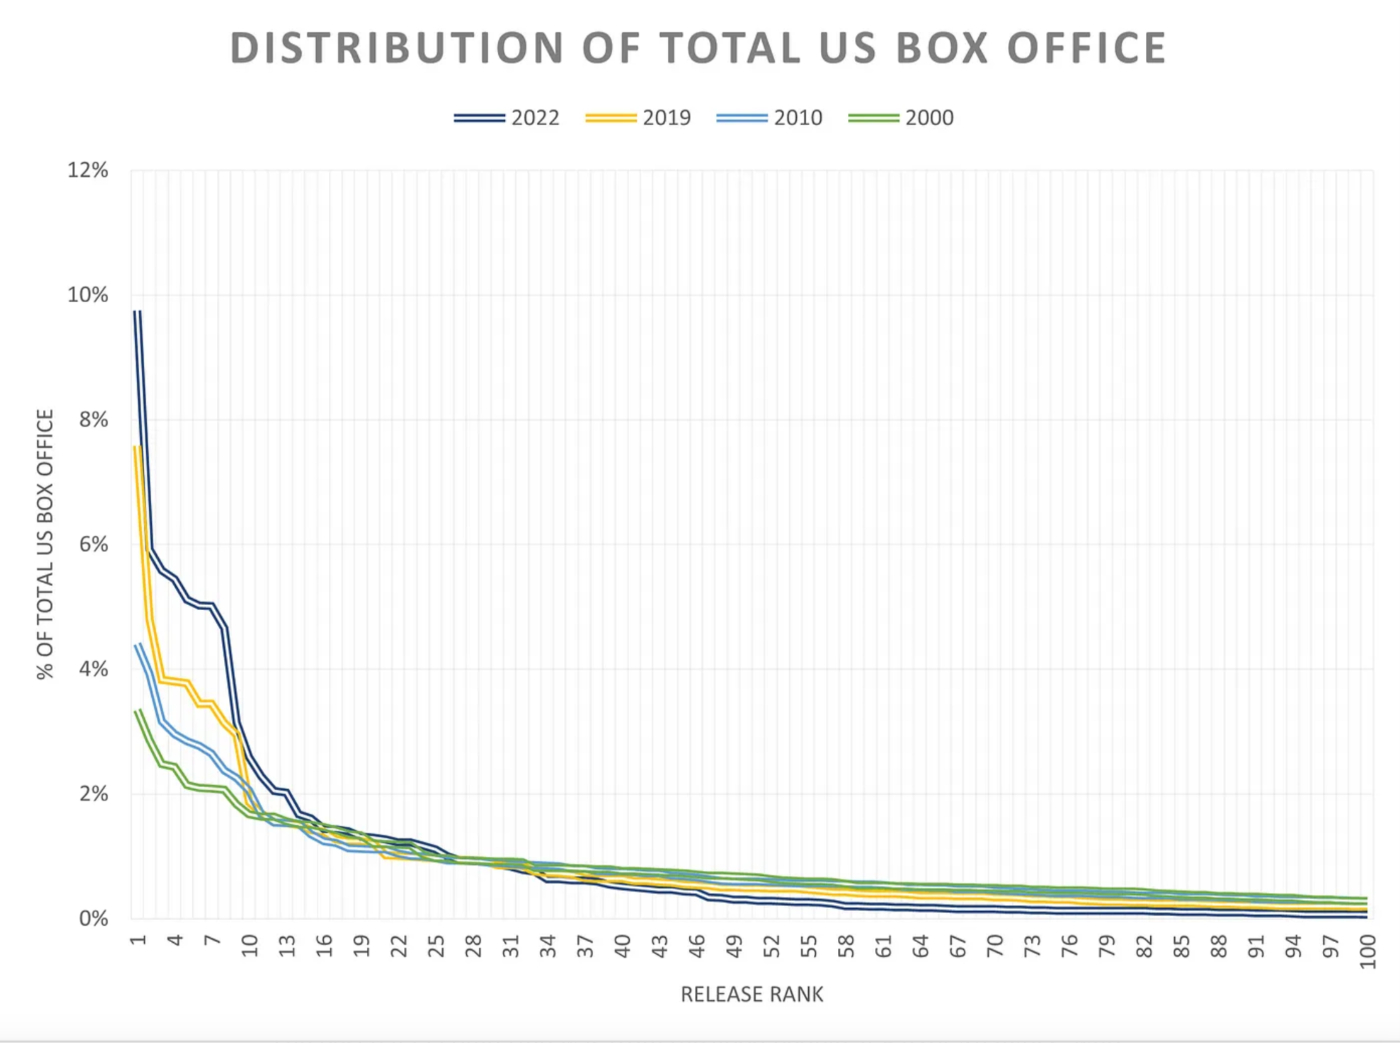
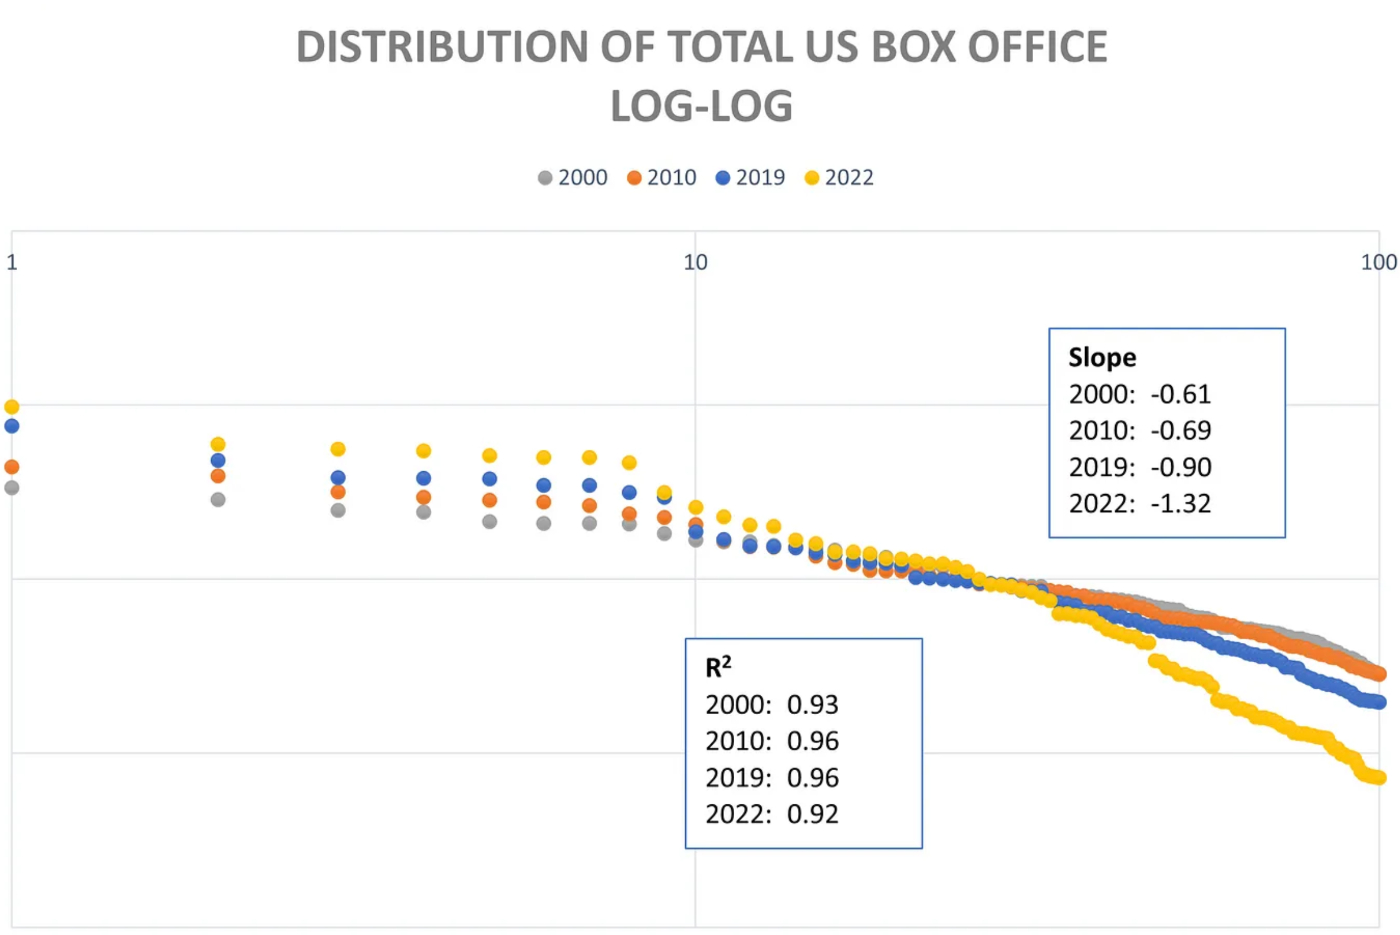
Relative to most other media, moviegoers face very few choices but extraordinarily high opportunity costs. Not surprisingly, the relative distribution of consumption has become even more concentrated in the top hits in recent years. Figure 4 shows the distribution of total U.S. box office in 2000, 2010, 2019, and 2022 and the same data on a log-log basis. As shown by the r-squared values in the log-log plots, these are close to power law distributions. As also shown, over that time period the distribution has gotten increasingly extreme (i.e., the slope on the log-log plots has gotten increasingly negative); on a relative basis, the biggest hits are bigger than ever.
Figure 4. Distribution of box office getting more extreme
Source: Box Office Mojo, author analysis.Netflix TV series
In TV, the search and opportunity costs of finding and committing to a TV series are pretty high, which should lead to relatively extreme distributions. But it’s tough to test shifts in popularity distributions over time for all of TV because there is no good cross-platform (linear and streaming) measurement. And although Nielsen now provides streaming ratings, it’s only been doing so for a couple of years.
The best data I could find was from Parrot Analytics, who provided me with a time series of global demand for Netflix original series. Parrot’s demand metric incorporates a variety of inputs (social, fan and critic ratings, piracy, wikis, blogs, etc.) to gauge the popularity of each series and movie on each streaming service.
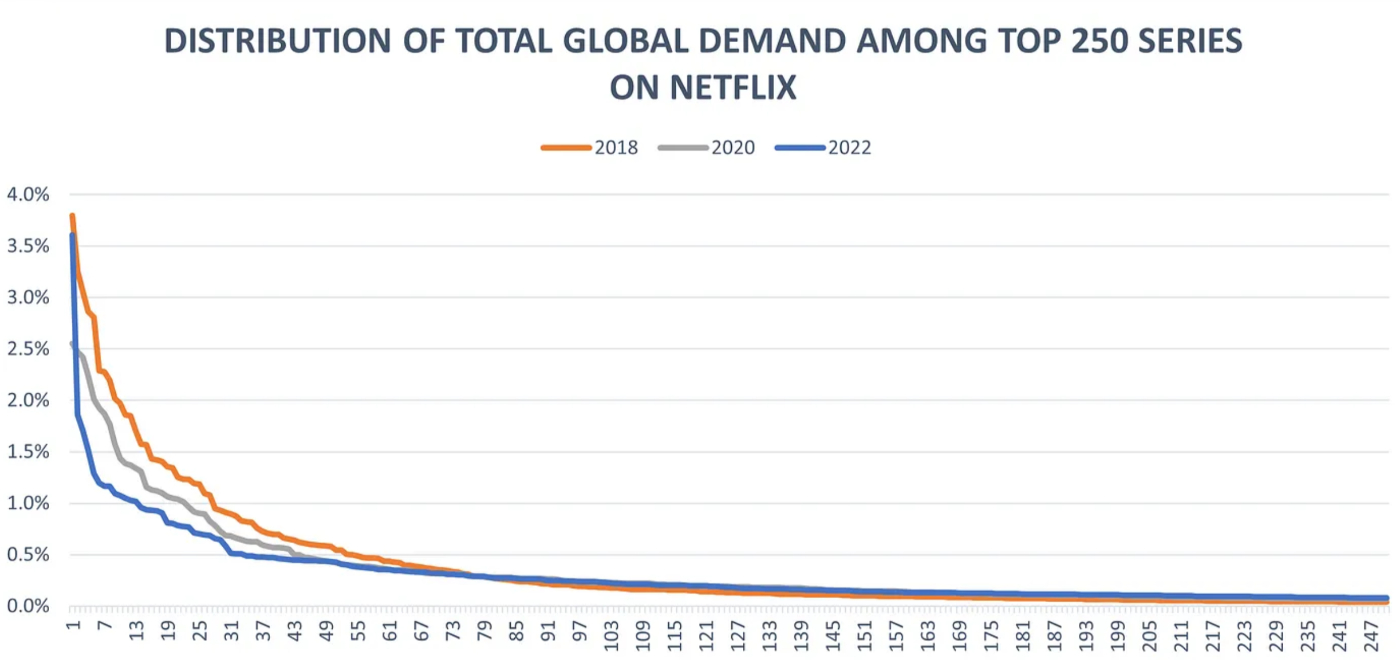
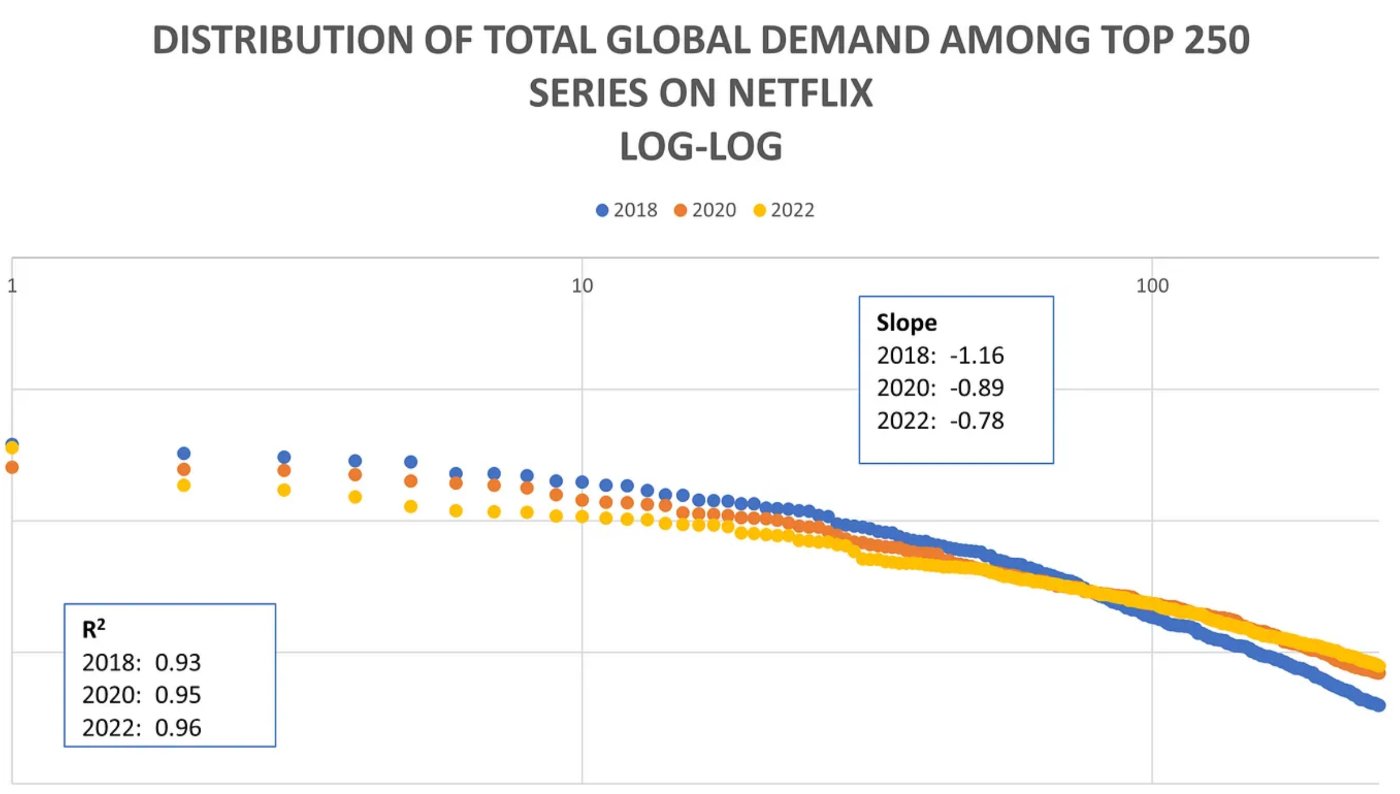
The most remarkable takeaway from this data is that it remains relatively skewed and is becoming more power law-like over time despite Netflix’s big international push over this timeframe. As noted, this is global demand and measures a period when Netflix added about 100 million subscribers, almost all of which were international, and its annual cash content spend increased from $13 billion to $17 billion, much of which was local content.
Despite its growth and increased spend internationally, as shown in Figure 5, globally demand remains concentrated in relatively few titles. Note that in 2018, 2020, and 2022, the top 10% of originals represented ~95%, 85% and 75% of all global demand on Netflix, respectively.
Figure 5. Demand for Netflix series has remained skewed despite big international expansion
Spotify streams
Music is an interesting case because there are factors working in both directions. On the one hand, with so much choice (Spotify has over 80 million tracks and 100,000 new songs uploaded every day), listeners use both social signals and recommendation engines to discover new music. And most streaming services’ recommendation engines rely heavily on collaborative filtering (see a description of Spotify’s recommendation engine). This implies a relatively extreme distribution.
On the other hand, the search costs and opportunity cost of trying a new song are very low and easily reversed (you can easily skip to the next song). Both of those factors support a broader dispersion of consumption.
The result is that consumption in the head is extremely skewed toward the biggest hits, but also that more aggregate consumption is shifting into the tail. By implication, the “middle” is even skinnier than you would see in a pure power law.
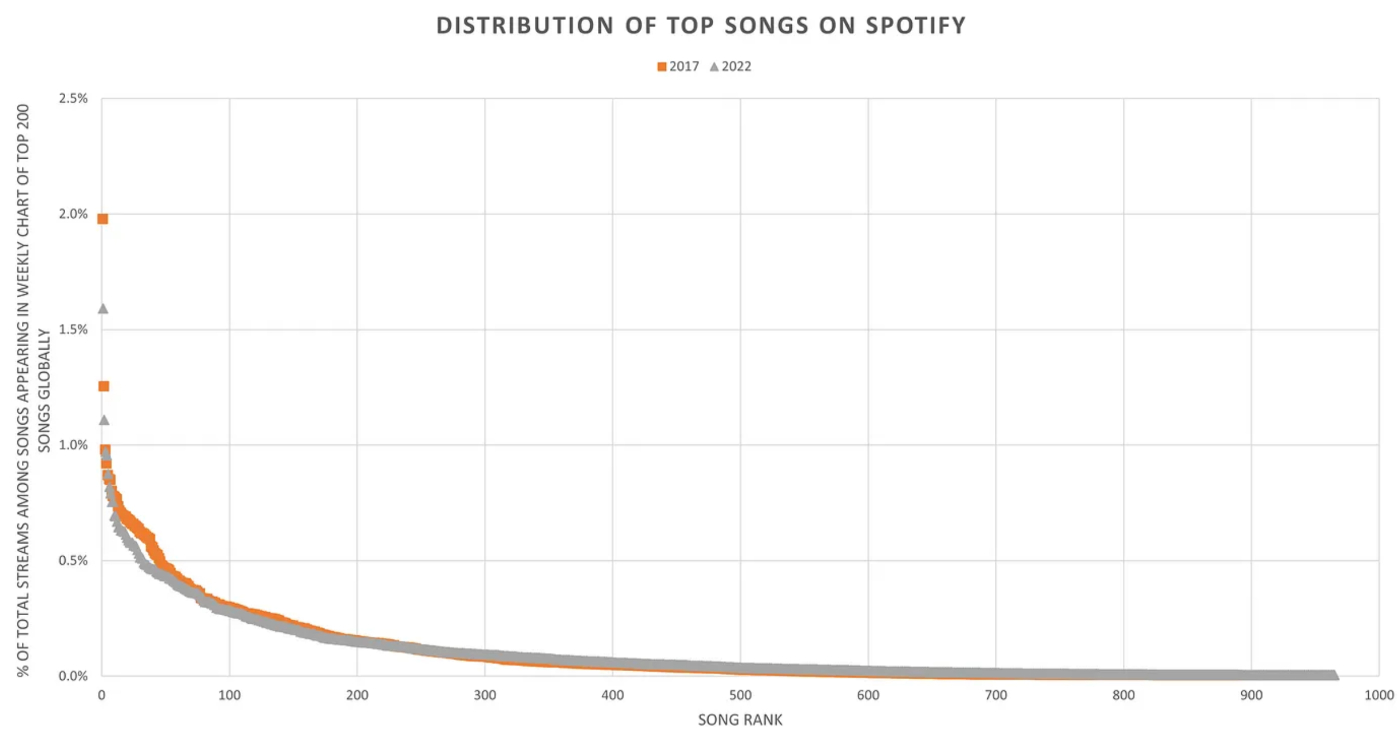
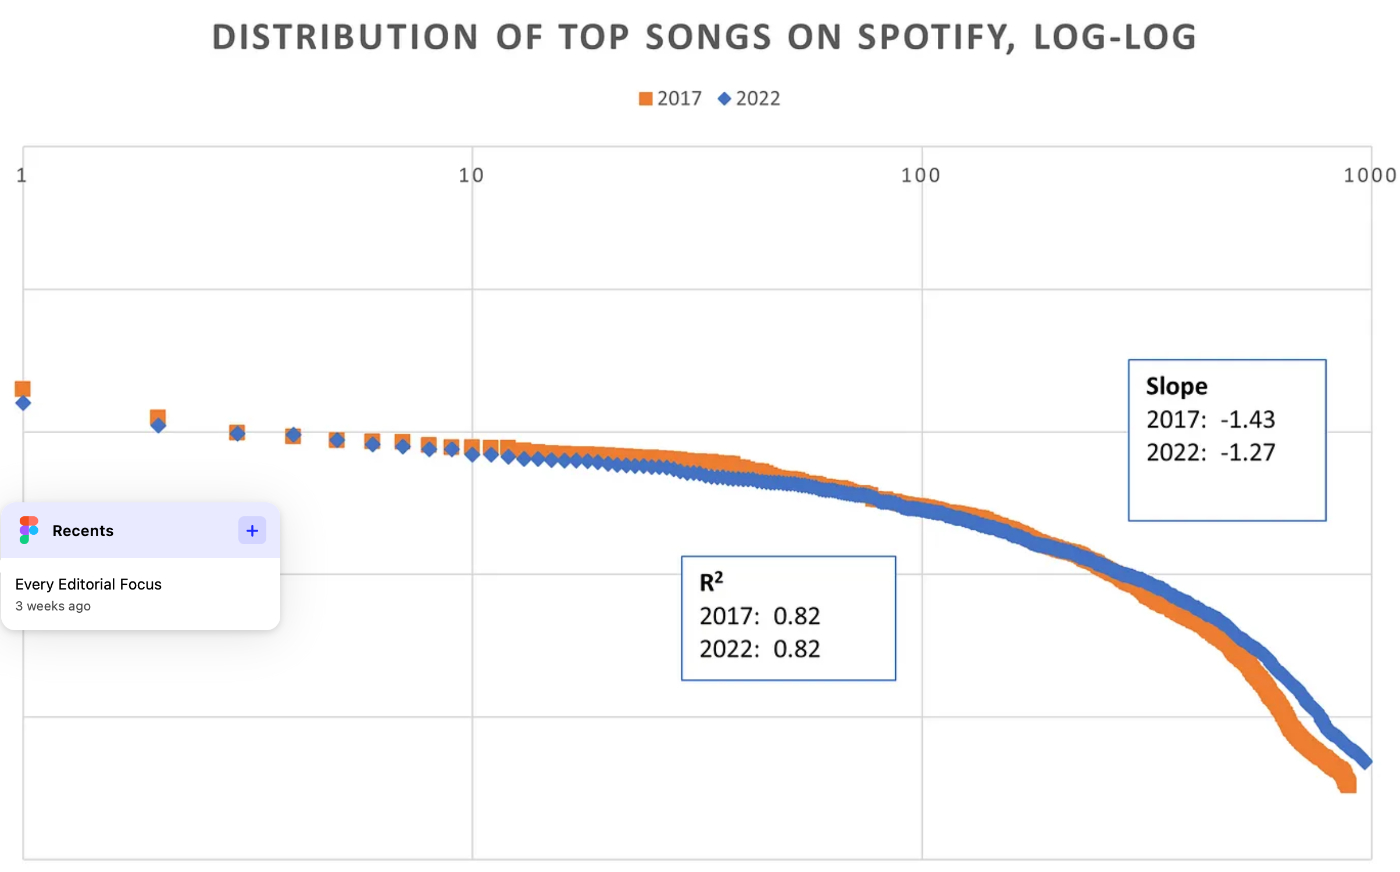
Figure 6 shows the distribution of consumption among all the songs that appeared in Spotify’s Global Top 200 Weekly at least once, in both 2017 and 2022 (and the same data on a log-log basis). In both years, that was about 1,000 songs. (This is the very head of the curve—it’s the top 1,000 songs out of 80 million, or the top 0.001%.) As illustrated by the slope on the log-log plots, the distribution is very extreme, even more so than box office. As is also evident, the slope is not constant; it becomes more negative as you move past the 100th most popular song. So, the biggest hits are even bigger on a relative basis and even more consumption is occurring in the tail than would occur in a true power law.
Figure 6. The head of the Spotify curve remains extreme…
Source: Spotify, author analysis.
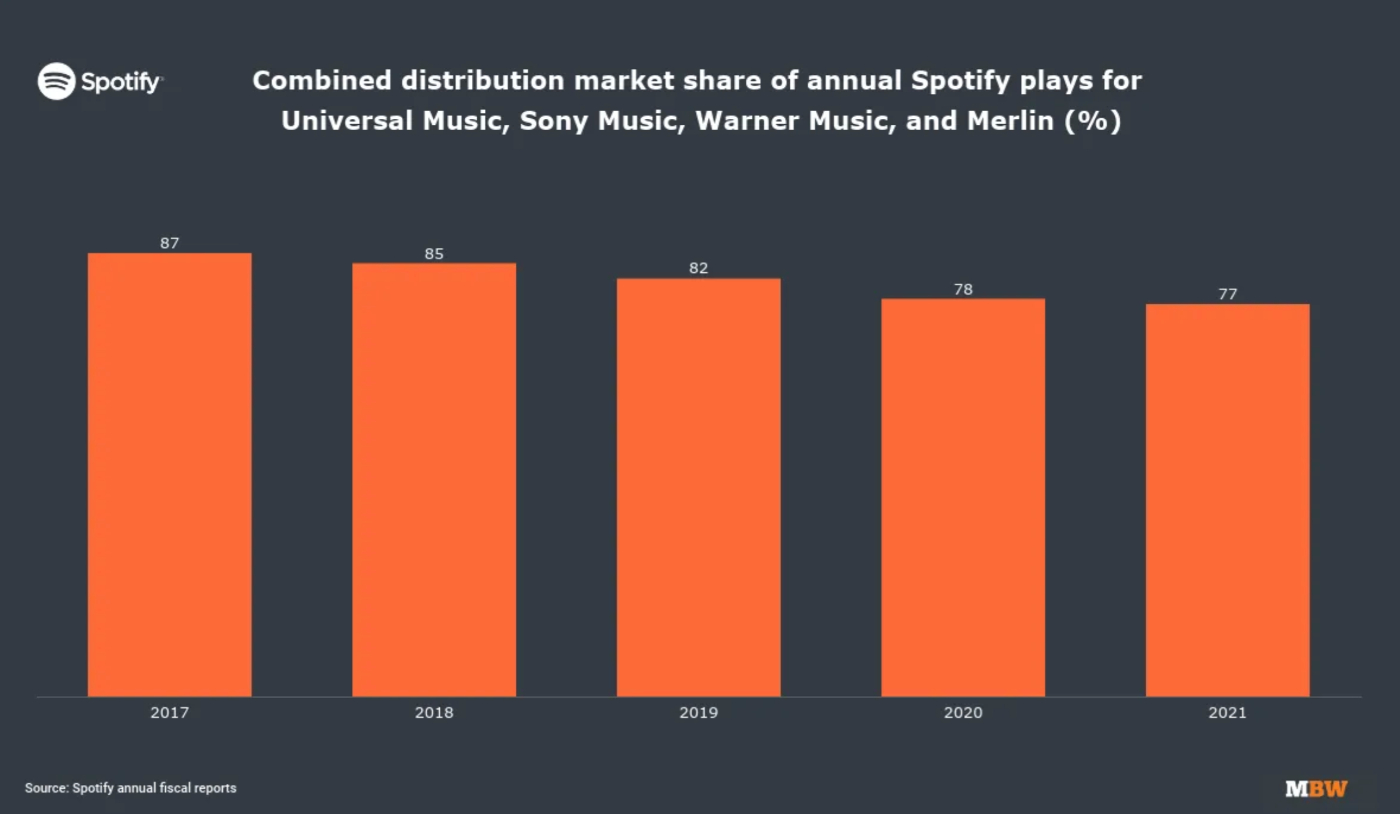
The idea that more consumption is shifting to the tail is corroborated by aggregate consumption data. As shown in Figure 7, based on Spotify’s reporting, the three major labels (Universal, Sony, and Warner Music) and Merlin (a partnership of independent labels) represented 77% of total streams in 2021, down 10 percentage points from 2017.
Figure 7. …But more consumption is also shifting to the tail
Source: Spotify company reports, via Music Business Worldwide.Patreon creators
Patreon provides a backend solution for creators to sell subscriptions, with more than 250,000 creators on the platform and 13 million patrons of those creators. It is also an interesting example because consumption distribution is unaffected by recommendation algorithms. While Patreon.com features a handful of creators on its landing page, few consumers visit it. They primarily navigate directly to creators’ Patreon pages from wherever their work is featured, such as YouTube, Apple podcasts, or their websites.
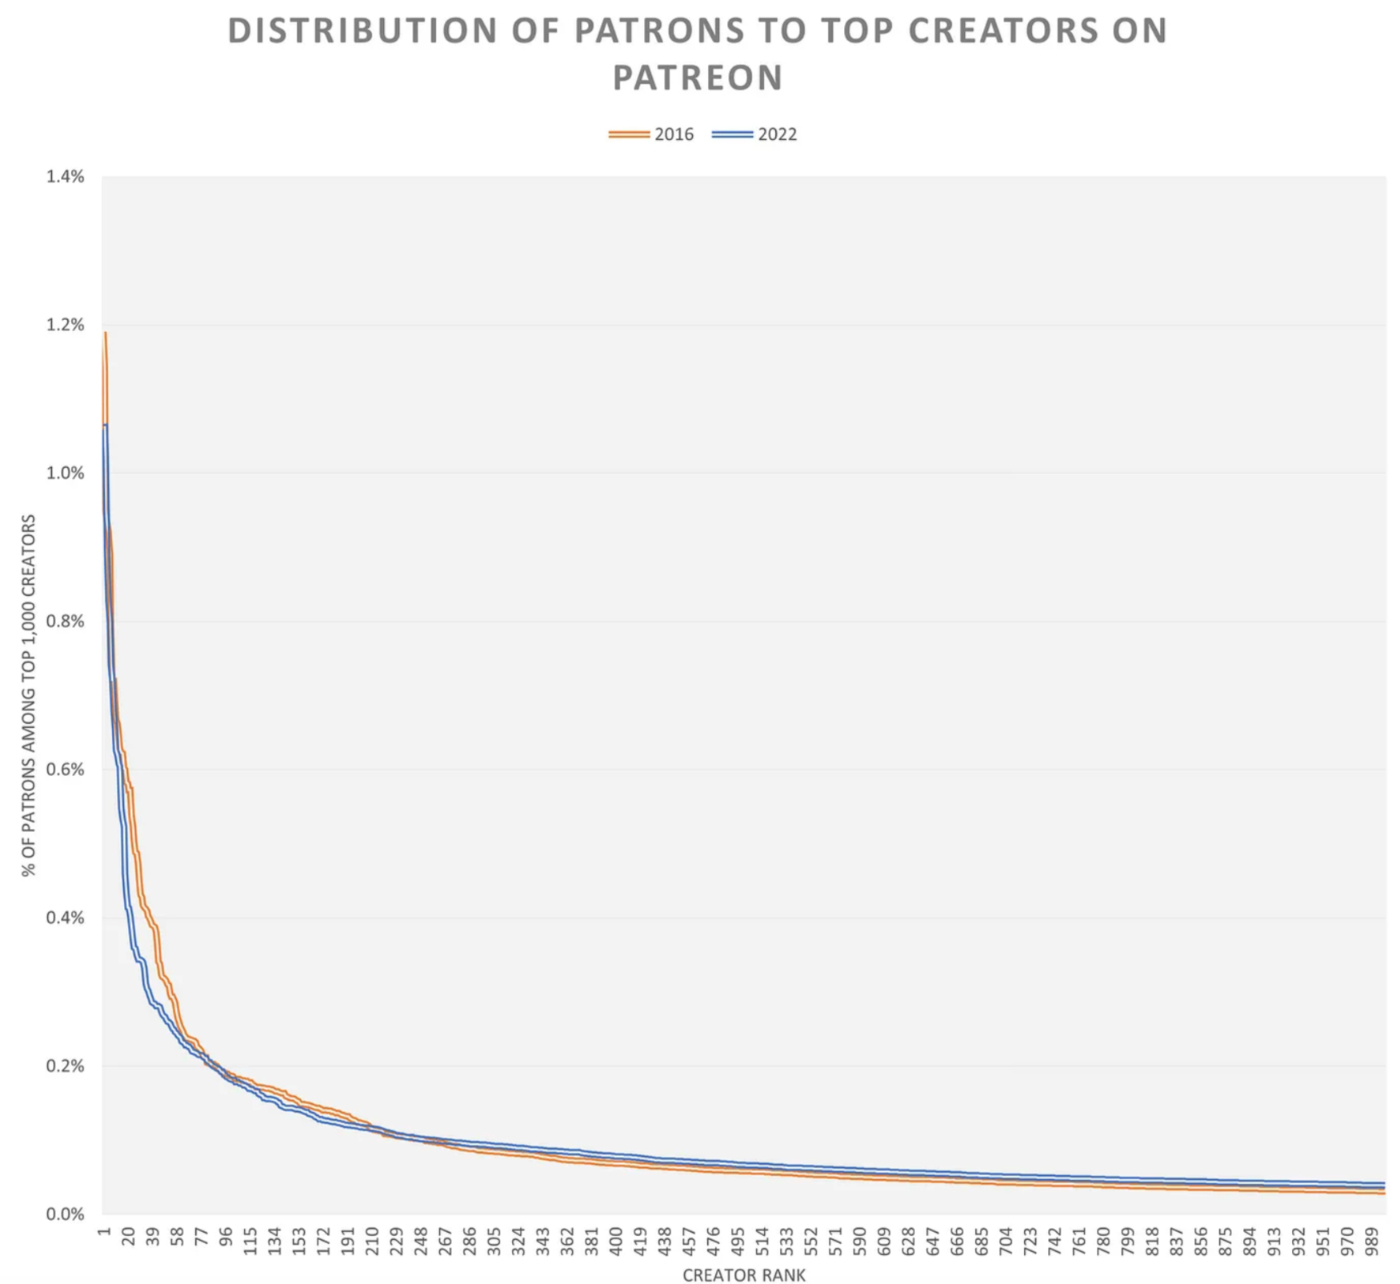
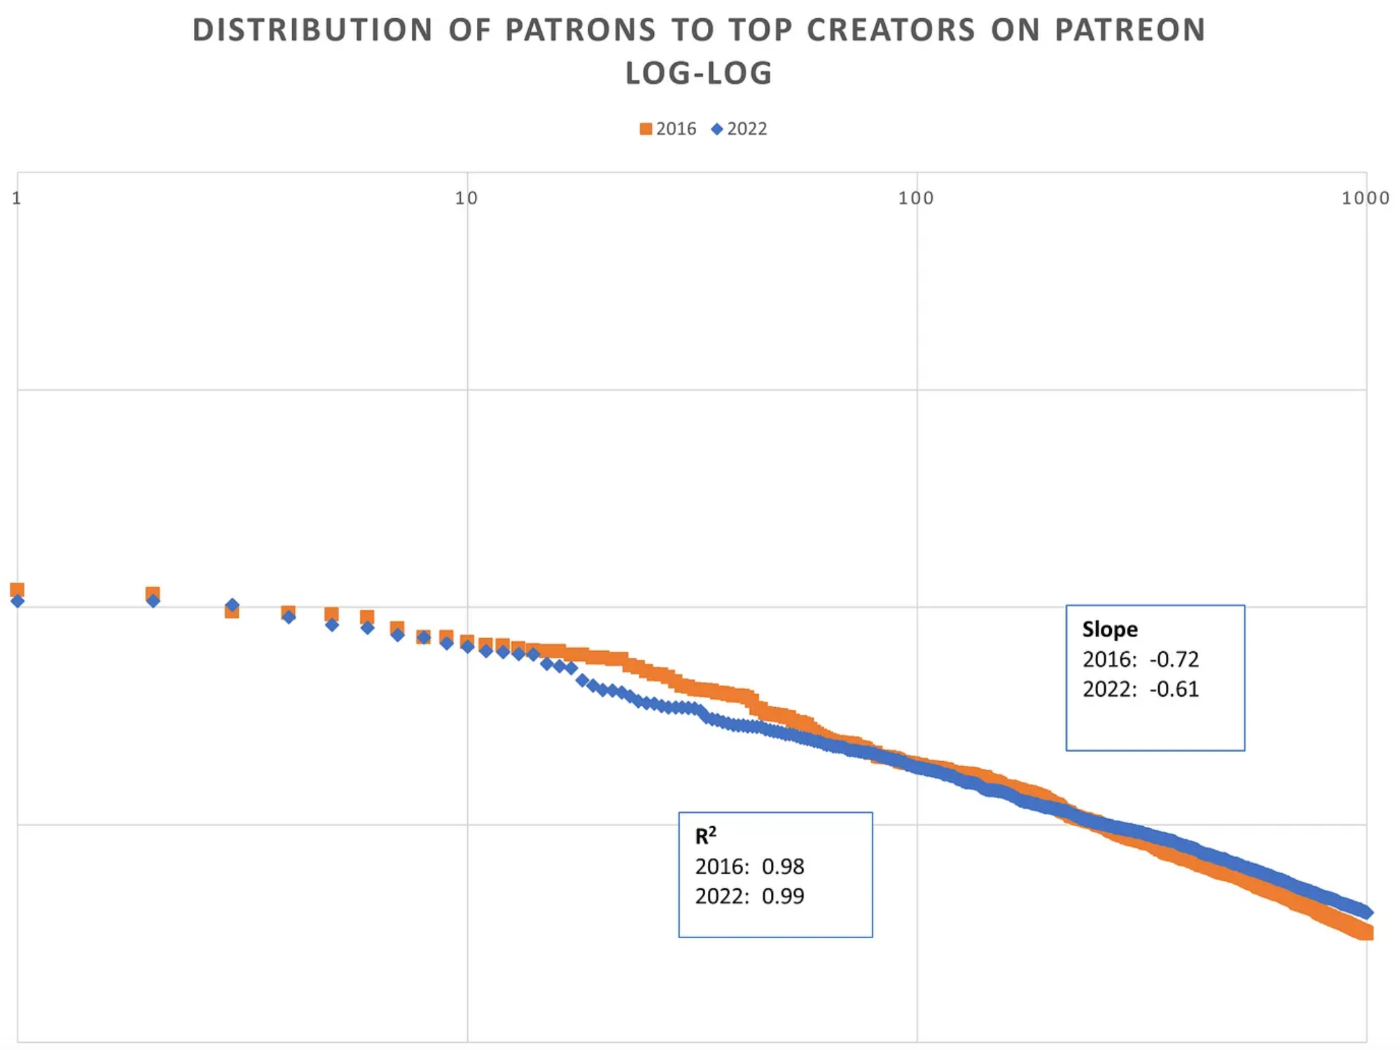
With no amplifying effect from recommendation algorithms, it should show a slightly less skewed distribution than some other examples. Figure 8 shows the distribution of the top 1,000 creators at the end of both 2016 and 2022 and the log-log data. Again, this is the head of the curve, or 0.4% of creators in 2022. As shown, the distribution tracks almost exactly as a power law, but the slope is less extreme than the prior examples.
Figure 8. The creator economy observes power laws, too
Source: Graphtreon, author analysis.
The pervasive implications of power laws
The persistence of these highly skewed consumption distributions has important practical implications for the media business and culture more broadly.
Hits will persist in an infinite content world
One of the questions I’ve been asked about infinite TV, which I mentioned at the beginning, is: will there still be hits in such a world?
The short answer: there will likely always be hits, if not even larger ones. As described above, the more choice, the more consumers need to rely on social signals and recommendation engines (which in turn rely on social signals) to manage search costs. This is already evident in music. High production value tools have been democratized, leading to a practically infinite amount of high production value music. But massive hits persist.
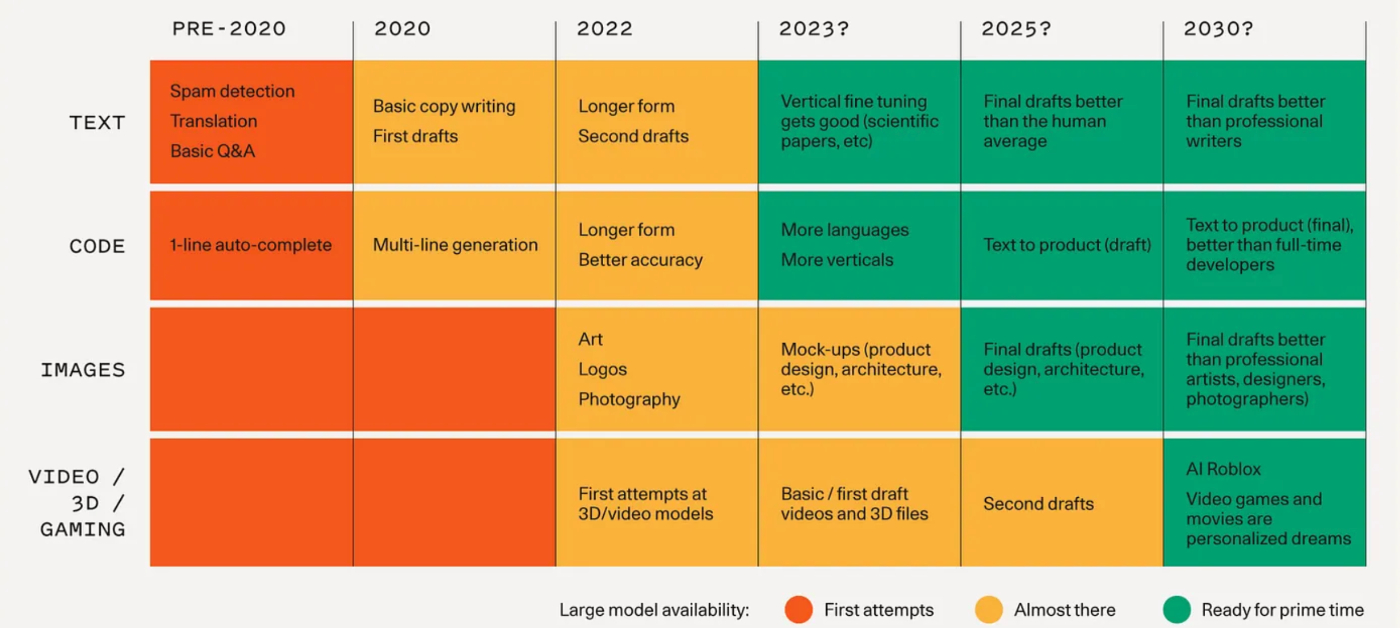
OK, but can we really use the word “always”? Let’s go really far out. What if eventually generative AI is able to create distinct personalized content for each individual? In a recent post about generative AI, Sequoia posited that by 2030, movies will be “personalized dreams” (Figure 9).
Figure 9. Will all content be “personalized dreams”?
Source: Sequoia.This may not be as far-fetched as it sounds, at least technologically. Let’s say that by 2035 we are all wearing AR glasses, which record data about us that put Google and Facebook to shame. They track our gaze, including the length of time we linger on anything and the dilation of our pupils, respiration, and heart rate (h/t Rony Abovitz). They might know more about us than we know ourselves. Let’s go even further. Perhaps we’ll wear devices that record brain activity as we sleep and reconstruct the imagery from our dreams. Sounds crazy? Researchers in Japan just showed that this is already possible.
There is no way to disprove the concept of individualized content. But just because it might be technically possible doesn’t mean it will be popular. It runs counter to two fundamental human needs: 1) People want agency (or at least the appearance of agency) in their choices—they don’t want to be reduced to an algorithm (which is why Netflix recently removed its “Surprise Me” button). 2) More importantly, we are ultimately social animals and have a need to coalesce around common experiences. As I discussed in another recent essay, for many people, those shared experiences are entertainment (sports, music, gaming, movies, TV shows). At a time when loneliness is considered a public health crisis, it is hard to imagine that we would forgo shared experiences and retreat to lonely theaters of one.
Bye-bye, middle
If the biggest hits are as big as ever—or bigger—and the tail is also getting bigger, another implication is that the middle is going away.
What’s the middle? Consider the middle any content that attracted attention (and economics) solely because it benefited from formerly scarce distribution: local newspapers largely comprising syndicated news, TV stations with weak local coverage, radio stations without distinctive on-air personalities, middling general entertainment cable networks populated with second-tier reruns or inexpensive reality programming, mid-budget me-too theatrical releases, etc. It’s hard to define “the middle” with precision, but it’s safe to say that historically the middle has collectively generated a substantial proportion of profits in every media vertical.
Hits include a big dose of luck
Another important implication of this “power lawing” is that hits are increasingly random because of how information cascades work. I’m not arguing that all hits are random, but that luck is becoming more important.
More than 15 years ago, researchers Matthew Salganik, Peter Dodds, and Duncan Watts conducted an experiment to determine the effect of social influence on content choices. They split 14,000 subjects into nine groups, one “independent group” and eight “social influence groups.” All the subjects were invited to visit a website where they were asked to rate 48 unknown songs by unknown bands. They were able to download the songs if they chose. In the eight social influence groups, subjects could see how many times each song had been downloaded by prior visitors from their group; in the independent group, they couldn’t. At the end, the researchers tallied the popularity of the songs in each group.
The major conclusions were twofold: 1) each of the nine groups had different rankings of the songs (while some songs tended to be more popular and some songs were consistently less popular, other than that the rankings were quite different); and 2) the distribution of popularity within the social influence groups was more extreme than in the independent group. The second conclusion supports the main point of this essay, namely that the presence of social signals will cause the distribution of popularity to be more skewed.
But let’s think about the implications of the first conclusion, namely that each group produced a different popularity ranking. It implies that hits require a high degree of luck.
To see why this happens, try out a thought experiment (borrowed from Michael Mauboussin in his book More Than You Know). Imagine a barrel with 1,000 balls in it, each of which is numbered 1–10, and there are 100 of each number (100 #1s, 100 #2s, etc.). Also imagine you have 10 urns, each marked 1–10. Now randomly pick 10 balls out of the barrel and, based on the number marked on each, put each ball in its corresponding urn. Replace the 10 balls you removed from the barrel with new balls, but this time the distribution of new balls will be equivalent to the distribution of balls in the urns. (If there are two balls in urn #2 and none in #3, then two of the new balls should be marked #2 and none should be marked #3.) Keep running the process, removing 10 balls from the barrel at random, placing them in the corresponding urns, and adding new balls to the barrel based on the distribution of balls in the urns. After you run this process for enough cycles, what you find is that the urns with more balls are increasingly likely to have more balls added each time.
Or think of a real-world example: Amazon reviews. The Amazon algorithm places the reviews with the most “helpful” votes at the top. Naturally, most people start at the top and read just a few reviews. The first reviews written for a new book will appear at the top of the page (for lack of many reviews). So they are more likely to be read and deemed helpful than subsequent reviews. This creates a positive feedback loop: they are more likely to remain near the top of the page, making it likely that new visitors will mark them as helpful, cementing their position at the top of the page.
This phenomenon (which I referred to above as the rich-get-richer effect, cumulative advantage, or preferential attachment) shows that in a networked environment, popularity is influenced by luck and highly sensitive to initial conditions. The balls that happen to be selected first (or the reviews that are written first) have a much higher likelihood of dominating. Even in a hypothetical world in which all content was of equal quality there would still be massive, random hits. Was the success of PewDiePie or Charlie Puth inevitable? Hard to say.
As content consumption is increasingly affected by network dynamics, hits will become more unpredictable. And just as in the financial markets, higher volatility means higher risk, and higher risk means lower returns.
Hits can (and will) emerge from the tail
A corollary of the prior point is that hits can, and will, emerge from the tail. Again, this is already evident in music. As I wrote:
[A]lmost all of the new breakout acts of the last few years—like The Weeknd, Billie Eilish, Lil Uzi Vert, XXXTentacion, Bad Bunny, Post Malone, Migos, and many more—emerged from the tail of self-distributed content, not from A&R reps hanging around at 2 a.m. for the last act.
Writing compelling fiction, composing a catchy pop song, conceiving innovative gameplay, or writing a great screenplay are extraordinarily rare talents. It is reasonable to think that many of the people capable of doing these things, with persistence and luck, are able to succeed through the traditional channels of content production and win the support of the small handful of people who control resources at places like HarperCollins, Republic Records, Blizzard, or Universal Pictures. But how many creative “lost Einsteins” are there who have fallen through the cracks? Thousands? Tens of Thousands? Hundreds of thousands?
Just as has occurred with the music labels, every traditional producer of any type of content should be prepared to both discover talent that emerges from the tail and compete with it.
There’s a reason every movie star wears tights
If it sometimes feels like every movie is a prequel or sequel or about superheroes (or both) and every new TV show is a spinoff or reboot, that’s because a disproportionate percentage of them are.
The reasons often cited for this include entertainment companies’ crass commercialism, the death of creativity, and the dumbing-down of the American consumer, among others. But looking at this through the lens of the network dynamics described in this essay suggests several other reinforcing reasons. Established IP reduces risk because it:
- Lowers consumer search costs. Consumers are overwhelmed by choice and the resulting high search costs. Well-known brands, talent, and franchises reduce those costs, making consumers less reliant on network signals.
- Benefits from a pre-existing community. Consumers sometimes choose content because of a desire to join a community or enhance their standing within it. Established IP has established communities, increasing the community’s influence.
Whether this is good or bad is a different question. There is a risk that major media companies lean too heavily on established IP and all the innovative ideas instead emerge from the tail. But there is a clear logic behind it.
Rents will likely shift even more toward top talent
The details of how talent is compensated in creative businesses can be extraordinarily complicated and opaque. If you abstract it out, however, ultimately talent compensation is a function of the underlying economic structure of the industries in which they operate.
At a time when there is both more transparency of performance data and greater competition for superstars, a more extreme distribution of consumption will likely shift even more bargaining power to the top talent. Among countless examples, that’s why Tom Cruise reportedly made more than $100 million for Top Gun: Maverick, and Taylor Sheridan, showrunner of Yellowstone, holds so much sway over Paramount.
No one is policing the algorithm
Algorithms clearly influence the distribution of consumption and they will become increasingly important. According to Spotify, 1/3 of new music discovery occurs through algorithmic recommendation. Netflix says that 80% of watch time comes from its recommendations and 20% from direct search (but it also concedes that “users tend to come to the service with a specific show, movie, or genre in mind”). All things equal, the more choice, the more consumers will seek help in choosing, whether from the organic social signals that emerge from the network or recommendation systems.
Platforms have a strong incentive to surface the best recommendations. More usage increases consumer affinity, improves retention, and, for ad supported platforms, increases revenue. But, at least on the margin, they may have other incentives. Spotify and Netflix both have an incentive to reduce their reliance on their largest suppliers. Both Spotify and TikTok disclose that “commercial considerations” influence their recommendations. Not much can or will likely be done about this, but the opacity and importance of algorithms will become an increasingly important competitive advantage for content aggregators over time.
The creator economy and web3 live in Extremistan, too
Much has been written (including by me) about the rise of the creator economy and platforms and tools that enable creators to connect directly with—and generate revenue from—fans (not just Patreon, but Substack, OnlyFans, Cameo, and many others). Web3 promises an even more decisive step in that direction. Since web3 applications are decentralized, data is not mediated by centralized servers and creators retain ownership of their product. For many people, the greatest promise of web3 is to redistribute power and value from centralized institutions to creators and users.
While both the evolution of the creator economy and web3 should enable more creators to make a living wage, redistribution should not be confused with equal distribution, something I also discussed. As shown in the popularity distributions for Patreon creators above, as long as there are network dynamics, there will be power law-like popularity distributions.
Earned media is increasingly important
As mentioned in the study by Salganik, Dodds, and Watts, some of the subjects were placed in an independent group that received no social signals at all. The researchers used this group’s popularity ranking of songs as a proxy for “quality.” What they found among the other groups was that the songs considered best by the independent group rarely did poorly and the songs considered the worst rarely did very well, but anything else could happen.
The implication is that, as any marketer would tell you, marketing matters. Quality will not necessarily naturally rise to the top. The question is how to market.
Marketers draw a distinction between paid, earned, and owned media. Paid is traditional advertising: TV, outdoor, print, radio, retail media, display, search, and social. Earned is PR and word-of-mouth, increasingly through influencers. And owned is the brand’s own marketing channels, such as its branded content, website, retail outlets, catalogs, etc. Media companies tend to rely heavily on paid media—think of massive advertising campaigns to launch a new show or movie. As more content discovery occurs through the network itself, the value of paid media is increasingly diluted. It also becomes more important for marketers to understand what signals are emerging organically, and how to use both paid and earned media to amplify or counter those signals.
We’re not in Kansas anymore
Almost 30 years since the IPO of Netscape, the media industry is still coming to grips with the implications of the internet. The reality that it fragments attention is intuitive. The reasons why it also amplifies hits are less well understood.
For media companies, the implications of operating in a networked world are a mixed bag, at best. The good news is that hits still matter and likely always will. The bad news is just about everything else: the lucrative middle is being hollowed out; risk is climbing; the tail is becoming more competitive for hits; bargaining power is shifting to the top talent; content producers are increasingly at the mercy of curators’ algorithms; and paid media is being devalued. As consumers grapple with a growing tsunami of options, these dynamics will become more pronounced. None of this will get easier.
Doug Shapiro is an independent advisor and consultant and senior advisor for Boston Consulting Group. He writes about media on Medium, where this piece was originally published. Previously, he was the chief strategy officer at Turner (a division of Warner Media), SVP of international corporate strategy and head of investor relations at Time Warner, and an Institutional Investor-ranked analyst and Head of the Media and Telecom research group at Banc of America Securities.
The Only Subscription
You Need to
Stay at the
Edge of AI
The essential toolkit for those shaping the future
"This might be the best value you
can get from an AI subscription."
- Jay S.
Join 100,000+ leaders, builders, and innovators

Email address
Already have an account? Sign in
What is included in a subscription?
Daily insights from AI pioneers + early access to powerful AI tools








Comments
Don't have an account? Sign up!
Ain't there an error in general mathematical expression of a power law?