
Tokenomics 101 provided a high-level overview of how you could evaluate a project’s token. In this post I’m going to dive deeper into the supply side: how should the quantity of tokens, and the various ways that number changes (or can be manipulated) affect the perceived health of a project?
This may seem like a trivial factor at first glance. But understanding a token’s supply, and how that supply is going to change over time, is one of the biggest factors in your ability to get a good return on investing in a project. And unless you know where and how to look, it’s easy to get the wrong impression about the supply of a project.
Even seemingly straightforward metrics like Market Cap can be misleading or manipulated in unexpected ways. So let’s walk through everything you need to know when evaluating a token’s supply, so you’re more informed before you make your next investment.
What We Care About with Supply
The important aspect of supply isn’t necessarily the total number of tokens. It’s where the supply of tokens is right now, where it will be in the future, and how fast it will get there.
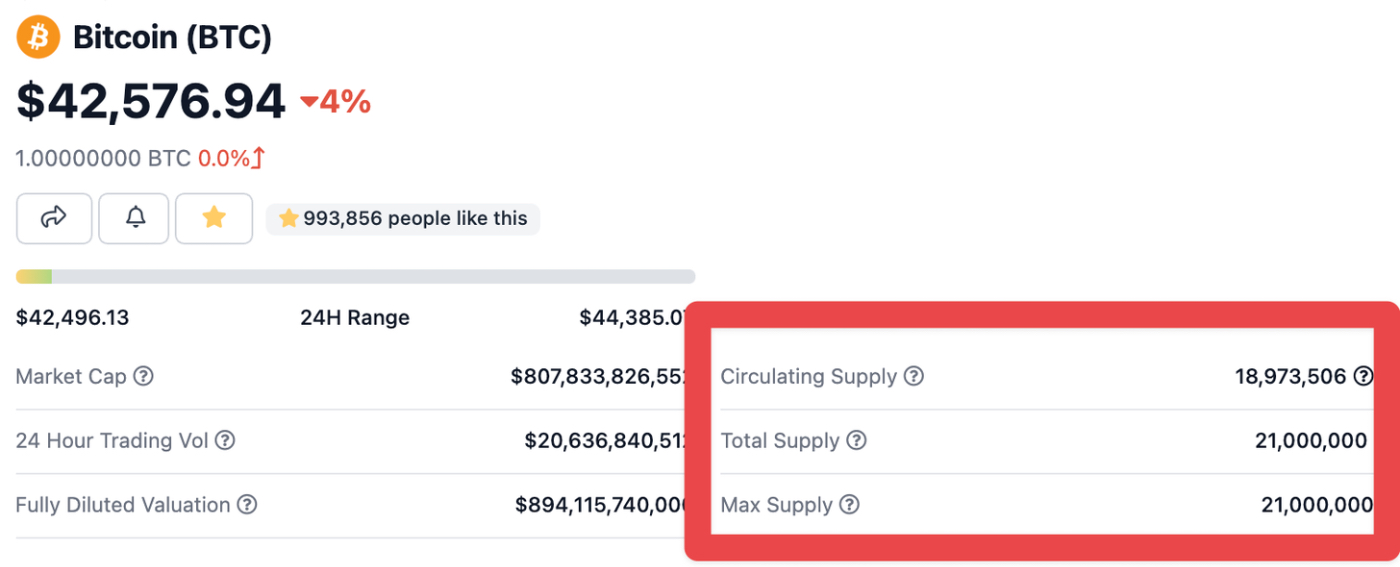
Let’s start with the simple classic, Bitcoin. The current circulating supply of Bitcoin is 18,973,506 and there will only ever be 21,000,000.
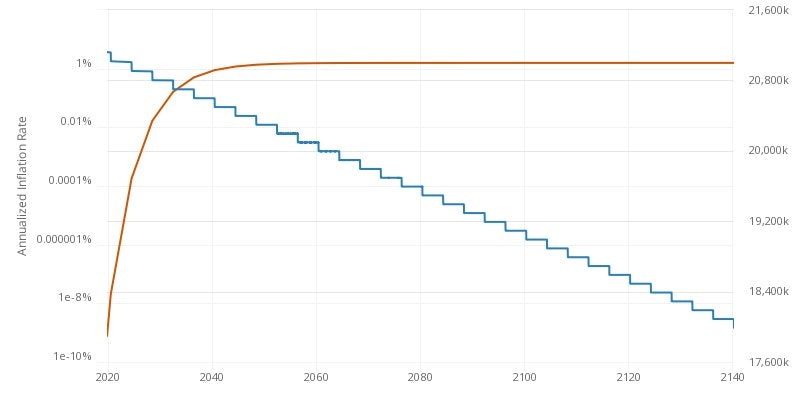
That last 9.6% of Bitcoin’s supply won’t be fully released until around 2140, so it’s going to take quite a while to get there. And we can see at any time what Bitcoin’s current inflation rate is, and there won’t be any surprises along the way. It’s fixed.
Bitcoin is easy too because there aren’t any investor unlocks, no team treasury, no cliffs, vesting, anything else that could mess this up.
Most cryptocurrencies are not this simple though. So while for Bitcoin we can just look at the Circulating Supply, the Max Supply, and the inflation chart and know where we are, most tokens make this a bit harder.
The main things we’re trying to figure out are:
- Where is the supply right now
- Where will it be in the future
- When will it be there
- How will it get there
Let’s go through the various things that can affect these questions, and then do some example analyses.
Market Cap & Fully Diluted Valuation
The market cap and the fully diluted valuation (FDV) are your two easy initial metrics for assessing the value of a cryptocurrency or token.
The market cap is the circulating supply of tokens multiplied by the token price. The FDV is the current price multiplied by the max supply, if all tokens were in circulation.
So if a token has a price of $10, a circulating supply of 10,000,000, and a max supply of 100,000,000, then the Market Cap would be $100,000,000 and the FDV would be $1,000,000,000.
These two metrics can be helpful when combined with the other variables we’re going to cover because they give you an idea of how the market is valuing a project today, and how that project needs to grow in the future to justify its current price.
If you see a big difference between the market cap and FDV, that means there are a lot of tokens locked up waiting to come on the market, and you should investigate how they’re going to enter the market (3 & 4) to see if you think the current price is justified.
If the market cap is 10% of the FDV and the tokens are all released in the next year, the project needs to grow 10x, or 1000%, in a year just to maintain its current price.
But if the market cap is 25% of the FDV and the tokens are released over 4 years, that’s only a 4x in growth over 4 years or about 40% growth year over year.
So the Market Cap vs. FDV ratio is one of the first things you’ll check out to give you some clues about the supply. And once you do, you’ll want to drill down on what the circulating supply and max supply numbers really mean.
Circulating Supply & Max Supply
Circulating supply and max supply help answer the questions 1 & 2, where is the supply right now, and where will it be in the future. And they help us understand the market cap and fully diluted valuation.
Max supply is fairly simple. What is the maximum potential supply of this token? For Bitcoin it’s 21,000,000. Ethereum doesn’t have one. For Crypto Raiders we set it at 100,000,000. For Yearn it’s 36,666.
Circulating Supply is where things get trickier. How many of a given token are circulating? For Bitcoin it’s easy, just subtract how many haven’t been released from the max supply and you have your number. Other L1s like Ethereum and Solana either self-report it or there are APIs available that monitor it.
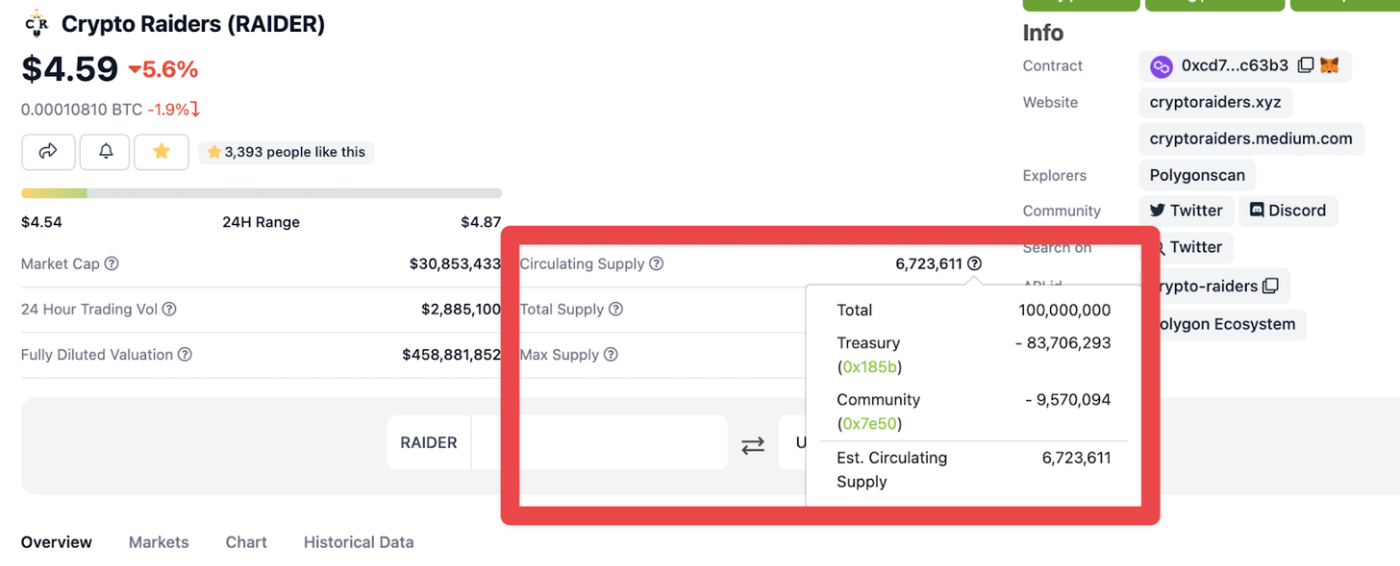
But it can quickly get complicated with project tokens. Here’s a simple example. For Crypto Raiders, we have released approximately 16,000,000 of our 100,000,000 total supply. But if you look on Coingecko, it says our circulating supply is only 6,723,611. Where are the rest?
Coingecko and other APIs will try to subtract out “inactive” tokens from the circulating supply, even if those tokens have been released to the market previously. In our case, people have locked 9.5m tokens in our staking contract for 3-12 months, so Coingecko subtracts those from the supply:
To me this seems a little silly. People chose to lock up those 9.5m, it’s not like we haven’t released them. But it is technically taking them out of circulation so I get it.
This shows though how important it is to dig into the circulating supply. At first blush it looks like only 6% of our tokens have been released, which would mean the project has to grow almost 20x to maintain its current price. But in reality, 16% of tokens have been unlocked, so it’s more like 6.25x.
Another great example of this is Curve.
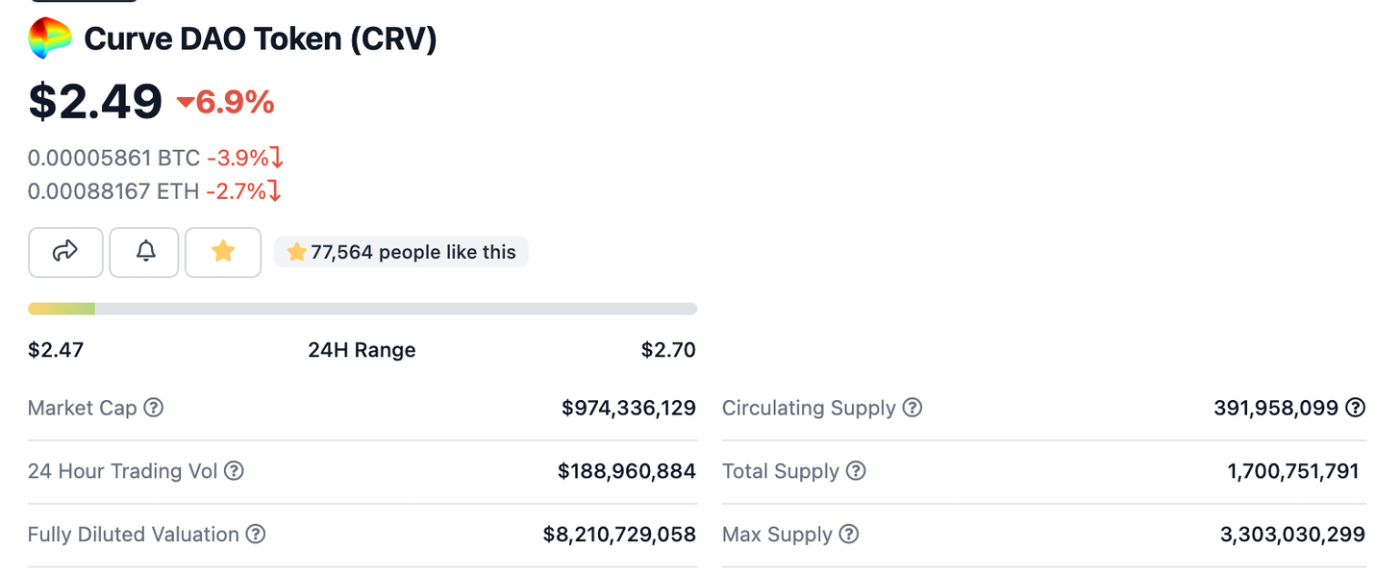
Their FDV is about 9x their market cap. And it looks like only 11% of their tokens are circulating. But they give you a clue here: the total supply. When we dig in on the circulating supply, we can see there are a ton of other tokens locked in various contracts:
One thing that stands out is “Founder” appears to have 572m tokens, and there are only 440m vote-locked CRV (covered in the Curve Wars article). That’s a lot of tokens for the Founder to have!
But when we dig in on that contract, it appears that it’s going to multiple people, so it’s not just one founder. And if you read the actual contract you can see the vest is over 4 years, so it’s going to take a while for these tokens to unlock.
The reason it’s worth doing this kind of breakdown is it helps you get a gauge for how many of these tokens the market has actually been exposed to. For me, I think the vote-locked CRV should count towards the market cap, which would make it more like 2.12b instead of 974m. That makes it quite a bit closer to its FDV, and shows that it doesn’t need to grow as much as it might seem for it to justify its token price.
But the circulating vs max supply is only part of the story. You’re going to feel pretty differently if the token supply is growing 4x in 4 months vs 4 years. Which is why we also need to look at the emissions schedule.
Emissions Schedules
Remember the main things we’re trying to figure out:
- Where is the supply right now
- Where will it be in the future
- When will it be there
- How will it get there
Circulating vs Max Supply tell us 1 & 2. The emissions schedule tells us 3 and 4: how and when it will get there.
The emissions schedule is when we usually have to dive into a project’s docs. This won’t be on Coingecko, so you’ll have to do a bit of sleuthing to figure it out.
In my last article on JonesDAO, I put together a chart showing their emissions over time:
The first thing that should stand out is they have a slow initial ramp in emissions, followed by an acceleration from 4/30/2022 to 10/30/2022. That’s the period when the private investors tokens are unlocking, and they’re unlocking linearly over 6 months.
For that 6 month period, there will be approximately 3% of the JONES supply being released each month. But for the period between now and April 30th, only 1.36% of the JONES supply is being released each month.
So for that 6 month period, the inflation rate will be more than doubled. And the new tokens entering the market will exclusively be going to people who got in at a heavily discounted price, who have much more of a financial incentive to sell even if the price doesn’t move between now and then.
That’s not to say the investors are malicious or that they will do this. Only that they could, and you should be aware of those kinds of changes to the future supply of a token before you start buying it.
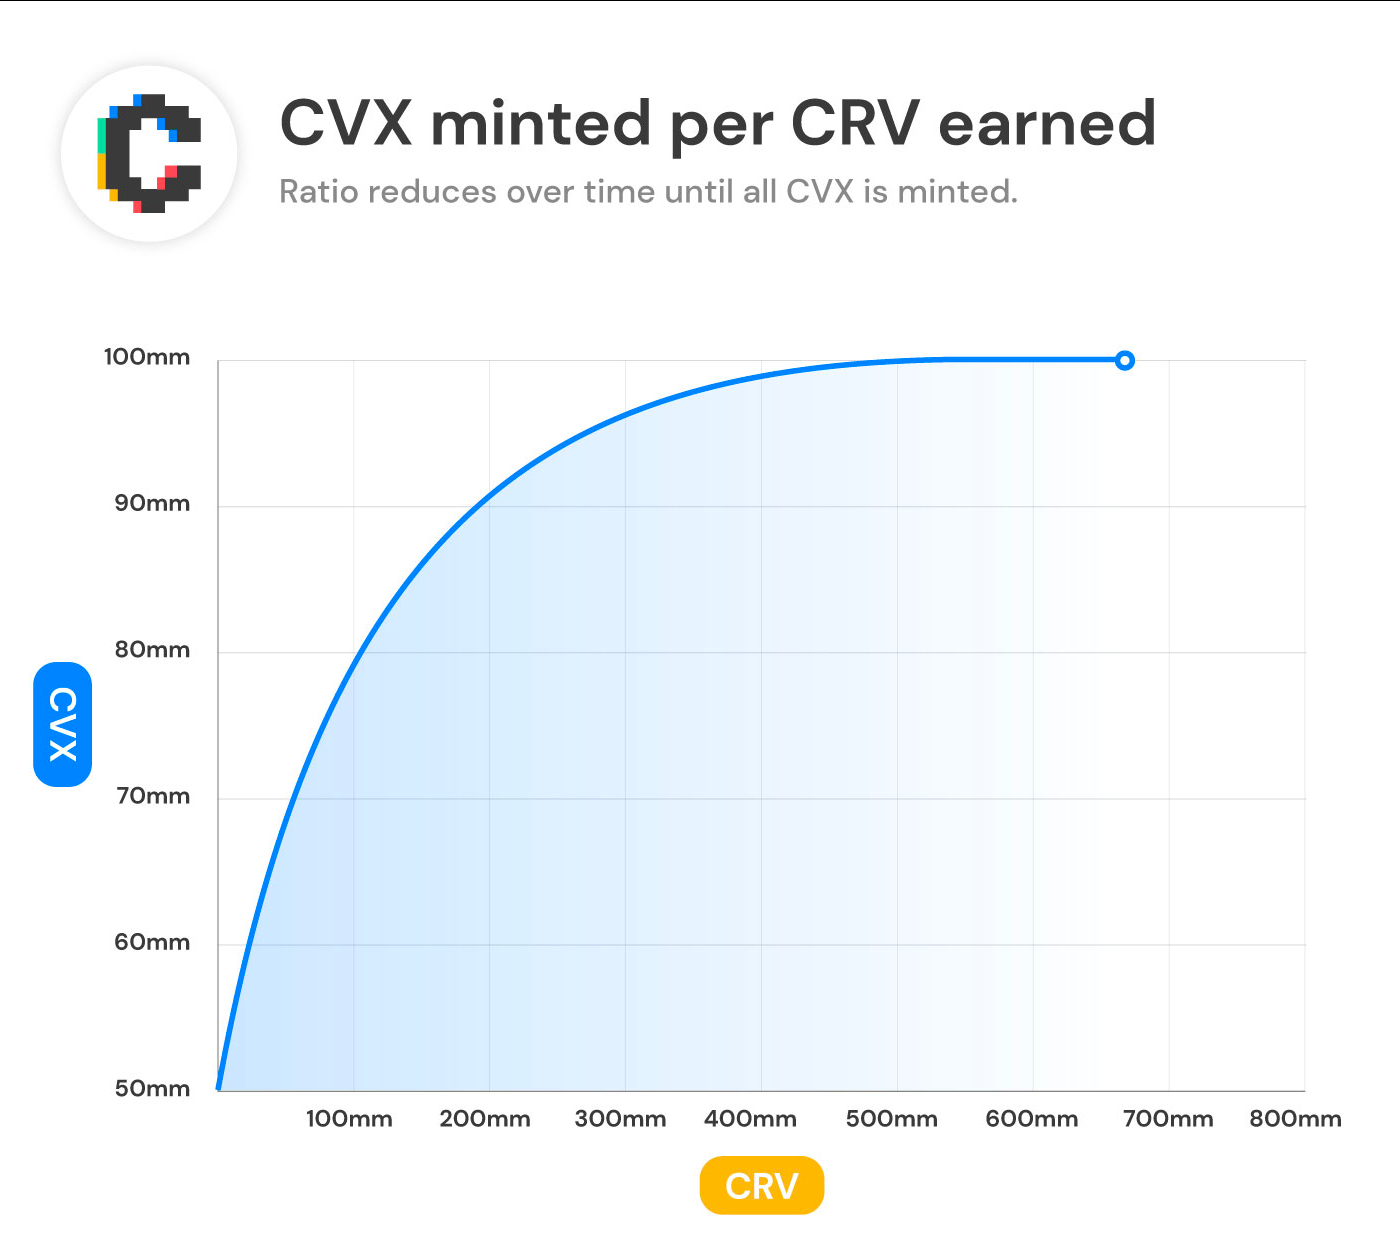
Another style of emissions you might see are platform performance based emissions. Convex is a good example of this, with most of the CVX tokens being emitted based on how many CRV tokens are earned using their pools:
This lets you know that the inflation rate for CVX is always going down, since the ratio of CVX : CRV minted will be reduced until they reach 100m CVX in circulation.
How Starting Liquidity Affects Emissions Rate
One sub-topic you want to consider for the emissions schedule is what the percentage changes look like. Even if there’s a gradual 4-year emissions schedule, if it starts from a very small percent of the tokens unlocked, that could be harmful to early buyers.
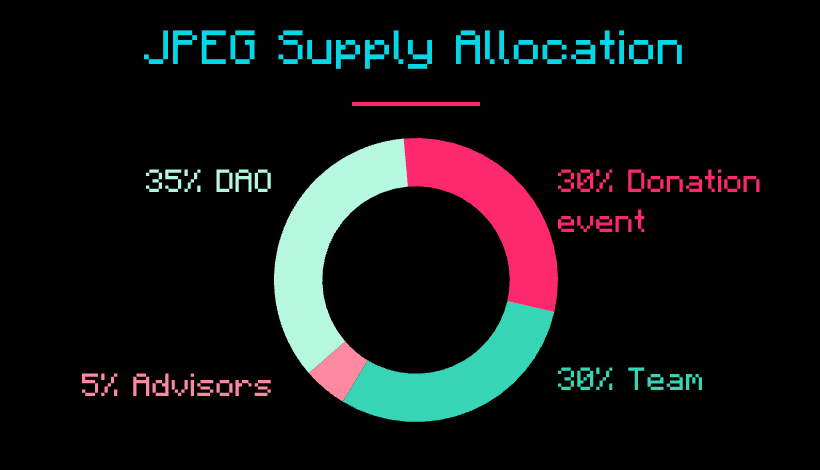
For example, let’s look at a new project that just launched their token, JPEG’d. They sold 30% of the token supply in a public auction, and then added liquidity for the token using some of the funds raised.
Their overall allocation is very straightforward:
The 35% of tokens allocated to the team and advisors are vested over 2 years, with a 6 month initial cliff. So 30% of tokens are initially unlocked, and then 35% come into the market over an 18 month period starting in month 6. So there’s approximately 2% of the supply hitting the market consistently per month for that period, then the inflation stops.
2% hitting the market when 30%+ is already in circulation is a relatively small increase. The token supply will double over 15 months, but that’s more than enough time for the value of the project to catch up to the token price.
Compare that to if only 10% of the tokens were initially released. Then the token supply would double in 5 months instead of 15! The early buyers would be much more impacted by the unlocks, and the token price would have a harder time keeping up with the new inflation.
Alright we’ve covered most of the important considerations. There are just a few last ones to factor in.
Initial Distribution & Farming
Most protocols will allocate a decent chunk of their token emissions to lp rewards. If you provide liquidity for the protocol, you can stake that liquidity to earn a steady stream of tokens.
On the surface this appears to be very community oriented, because anyone can buy the tokens, create liquidity, and stake it to earn more tokens. But depending on how it’s done, this could be a subtle way for the initial team or insiders to dramatically increase their share of the tokens.
The big recent example of this is LooksRare. As Cobie explained in his post on the topic, half of the farming rewards were available to early investors whose tokens were still locked. So while retail investors might have been under the impression that they were earning most of the fees of the platform, they were actually going to the early investors.
Another version of this can happen when a large share of the team’s or investor’s tokens are immediately unlocked, since they can then use those tokens for liquidity farming. What you want to see are at least three to six month lockups for teams and investors, with linear vesting after that.
Unlocks
The last important thing to watch is when large amounts of tokens might come unlocked. Some protocols like Convex have locking mechanisms that users have to opt into if they want to earn rewards for their tokens.
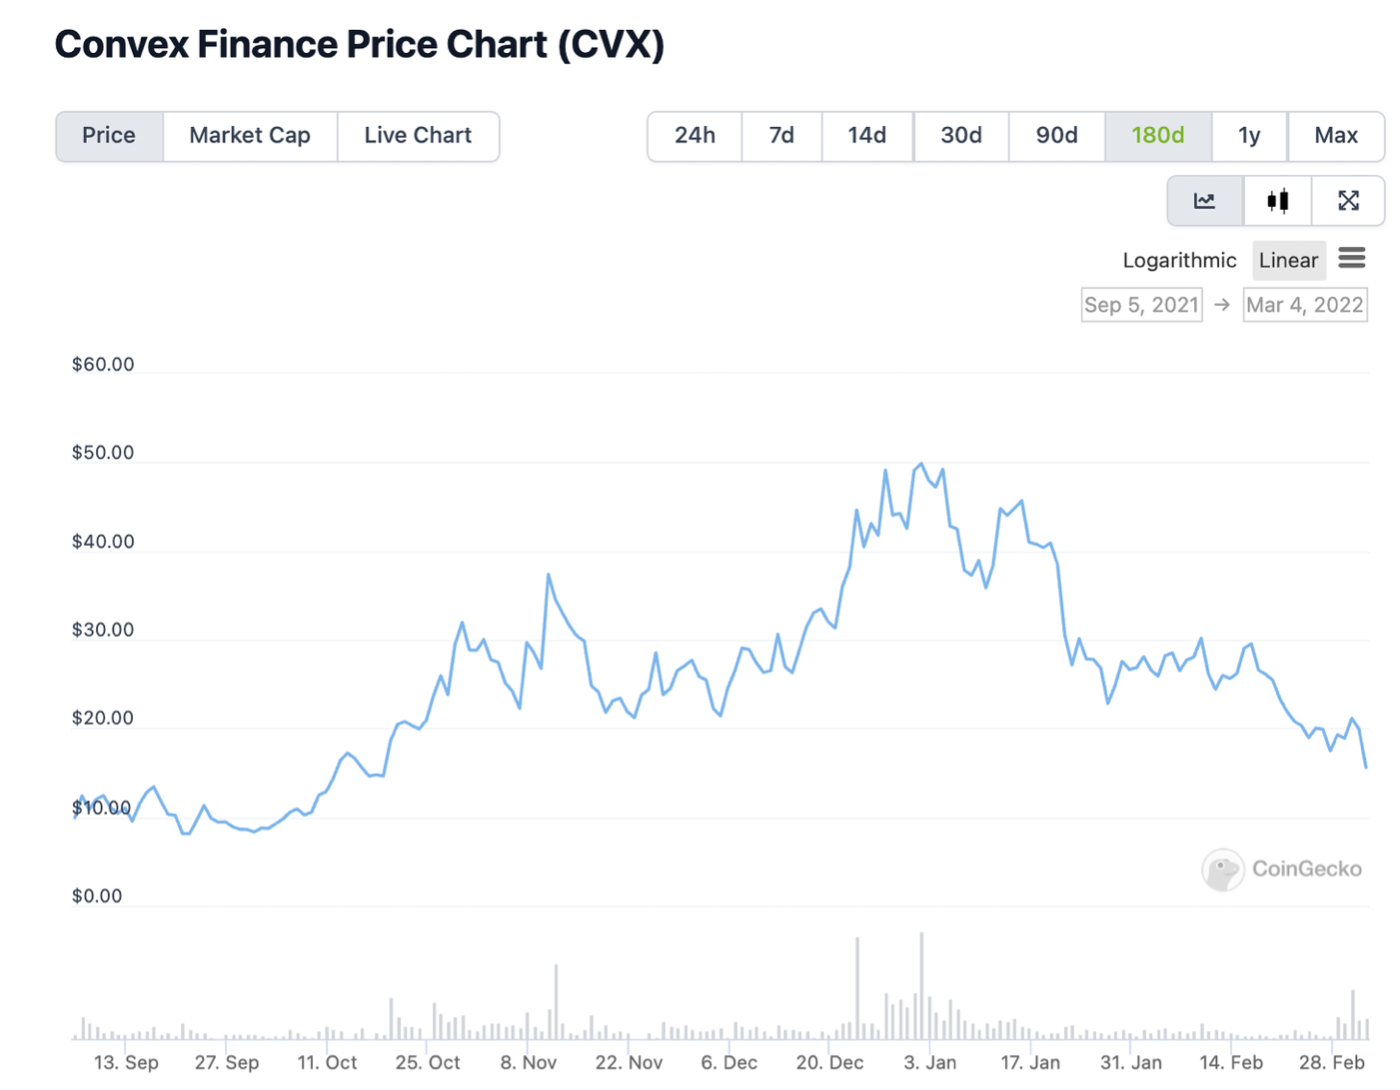
When Convex first launched this feature, a huge number of CVX holders locked their tokens in that first week. Which meant 17 weeks later, all of those tokens were coming unlocked. The mechanism was introduced at the beginning of September and those tokens started unlocking at the beginning of January. Notice anything?
There were other market movements going on at this time too, but it’s hard to ignore the effect that this locking and unlocking likely had. So if you’re buying a token with a veCRV style lockup, or any other locking mechanism, it’s good to be aware of when there might be a large unlock of the circulating supply.
Recap
When you’re digging into the token of a project, getting a good understanding of the supply and how it will change over time will give you a better sense of whether or not now is a good time to invest.
You can get a decent amount of the information from public dashboards like Coingecko, but digging into the details in a project’s docs can help flush out some of these subtler details like how the emissions schedule is changing over time, who the tokens are going to, and what unlocks might be happening in the future.
Supply is obviously just one piece of the puzzle though. So in future pieces of this series we’ll also dig deeper on demand, game theory, ROI, and other aspects to good tokenomics worth knowing before investing or launching a project of your own.
P.S. If you want help designing the tokenomics for your project, reach out on Twitter. Especially if it’s a game.
The Only Subscription
You Need to
Stay at the
Edge of AI
The essential toolkit for those shaping the future
"This might be the best value you
can get from an AI subscription."
- Jay S.
Join 100,000+ leaders, builders, and innovators

Email address
Already have an account? Sign in
What is included in a subscription?
Daily insights from AI pioneers + early access to powerful AI tools







Comments
Don't have an account? Sign up!
Hi Nat! The MC vs FDMC is solved through a Bonding Curve scheme? Thank you, very nice post!!
Hey Nat! Can you, please break down deeper what do you mean in "the project needs to grow 10x/4x…"? Are you saying about X of releasing tokens, which will affect on a token price or what?